

Max Headroom @Joel@social.cleverlibre.org
About me:
* Electrical engineer (chiphead) by training.
* Software architect/dev-herder (of late) by vocation.
* Computational quantum chemist by avocation.
* Tool-builder by compulsion.
Designed chips, joined/lead a few startups, VC wannabe for awhile. Then the wavefunction collapsed.
Technophile.
Autodidact.
ADHD sufferer/beneficiary.
Burner (the Man).
Dysthymic.
Romantic.
Kitten foster Dad.
I learn differently than others.
#QuantumMechanics #QuantumPhysics #QuantumChemistry #MonteCarloSimulation #ComputerArchitecture #Software
Joined Nov 2022
Max Headroom
boosted

#PhysicsFactlet
When a e.m. wave enters a medium with a higher refractive index (i.e. a glass slab) both the amplitude and the wavelength of the electric field are reduced by the same factor.
(Plus there are reflections at each interface.)
#Physics #Optics #Visualization

Max Headroom
boosted

This is actually quite amazing. They normally build their nests so carefully in the trees that it is very difficult to see. The kids are so cute. Oh, the cat is a nice touch. Squirrels (and cats) are sacred.
RT @_B___S@twitter.com
Squirrel makes a home outside a window and then moves the family in over the cold months
Max Headroom
boosted

Max Headroom
boosted

"Developers: stop moving things that I’m about to click on" is a great reminder to reduce layout shift on the web 👇
Max Headroom
boosted

The Milwaukee airport has my favorite airport sign in the country, hands down.
Max Headroom
boosted

Apparently, it’s rude to poke someone in the forehead and say, “skip intro,” when they start talking to you.
@Clementulus Because she's wiser than we are.
Max Headroom
boosted

"You were the Chosen One! It was said that you would destroy the VCs, not join them! Bring balance to the Web, not leave it in darkness!"

@lmedinar What is the sample rate for these plots? Or, stated differently, what are the time units for the X axis?
There's a related question I've struggled with - maybe you can help: How can one efficiently normalize a multi-fermion wave function composed of a determinant of single particle orbitals which are not orthogonal to each other?
I'm impressed by a Google Maps feature I just used for the first time. Walking around Manhattan, and it complained that location accuracy was low. Usually that's followed by it instructions for calibrating the accelerometer, involving a complex pas-de-deux with your phone.
This time it just asked me to point the camera at... basically anything. It instantly recognized my position from a random view on a random street.
While clearly it knew my approximate location, so the search space isn't unlimited, there could be different cars going by, etc. etc., not to mention an arbitrary field of view. I'm impressed.
Anyone have any details on how this computation is done?
@lmedinar I think you would learn a great deal by taking a quick look at the frequency spectrum of your input signal. There appears to be a noise source at a frequency around half your sample rate. You might be able to identify and remove it at the source, or remove it digitally with a notch filter.
Find a free DSP app and do a Fourier transform on the unfiltered input data to see what's going on.
@lmedinar What are we looking at here? Is this a time-domain plot? Which signal is the filter input?
Is there an easy way to filter my feed(s) to include only toots written in English?
Max Headroom
boosted

I’d been away from here for a few days. And the increased energy, critical mass is palpable
Max Headroom
boosted


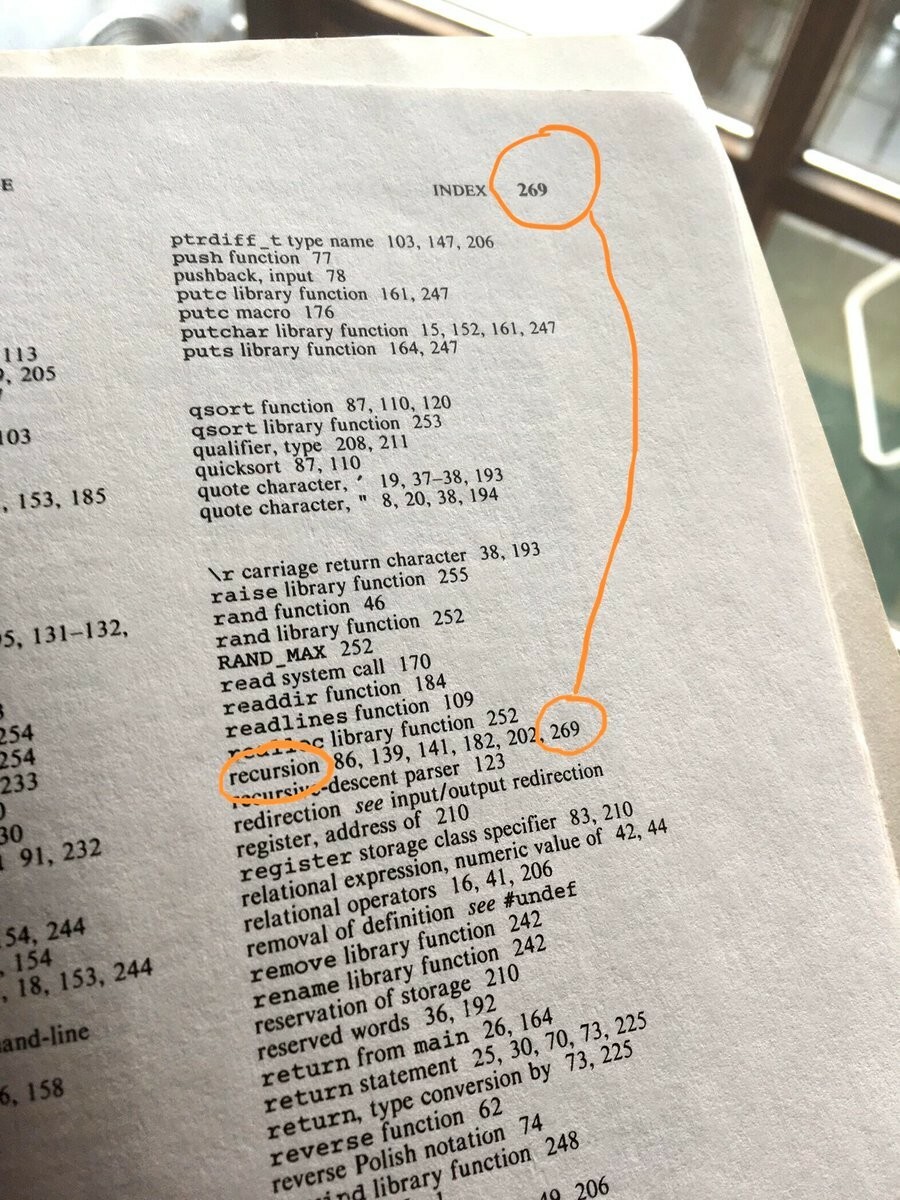
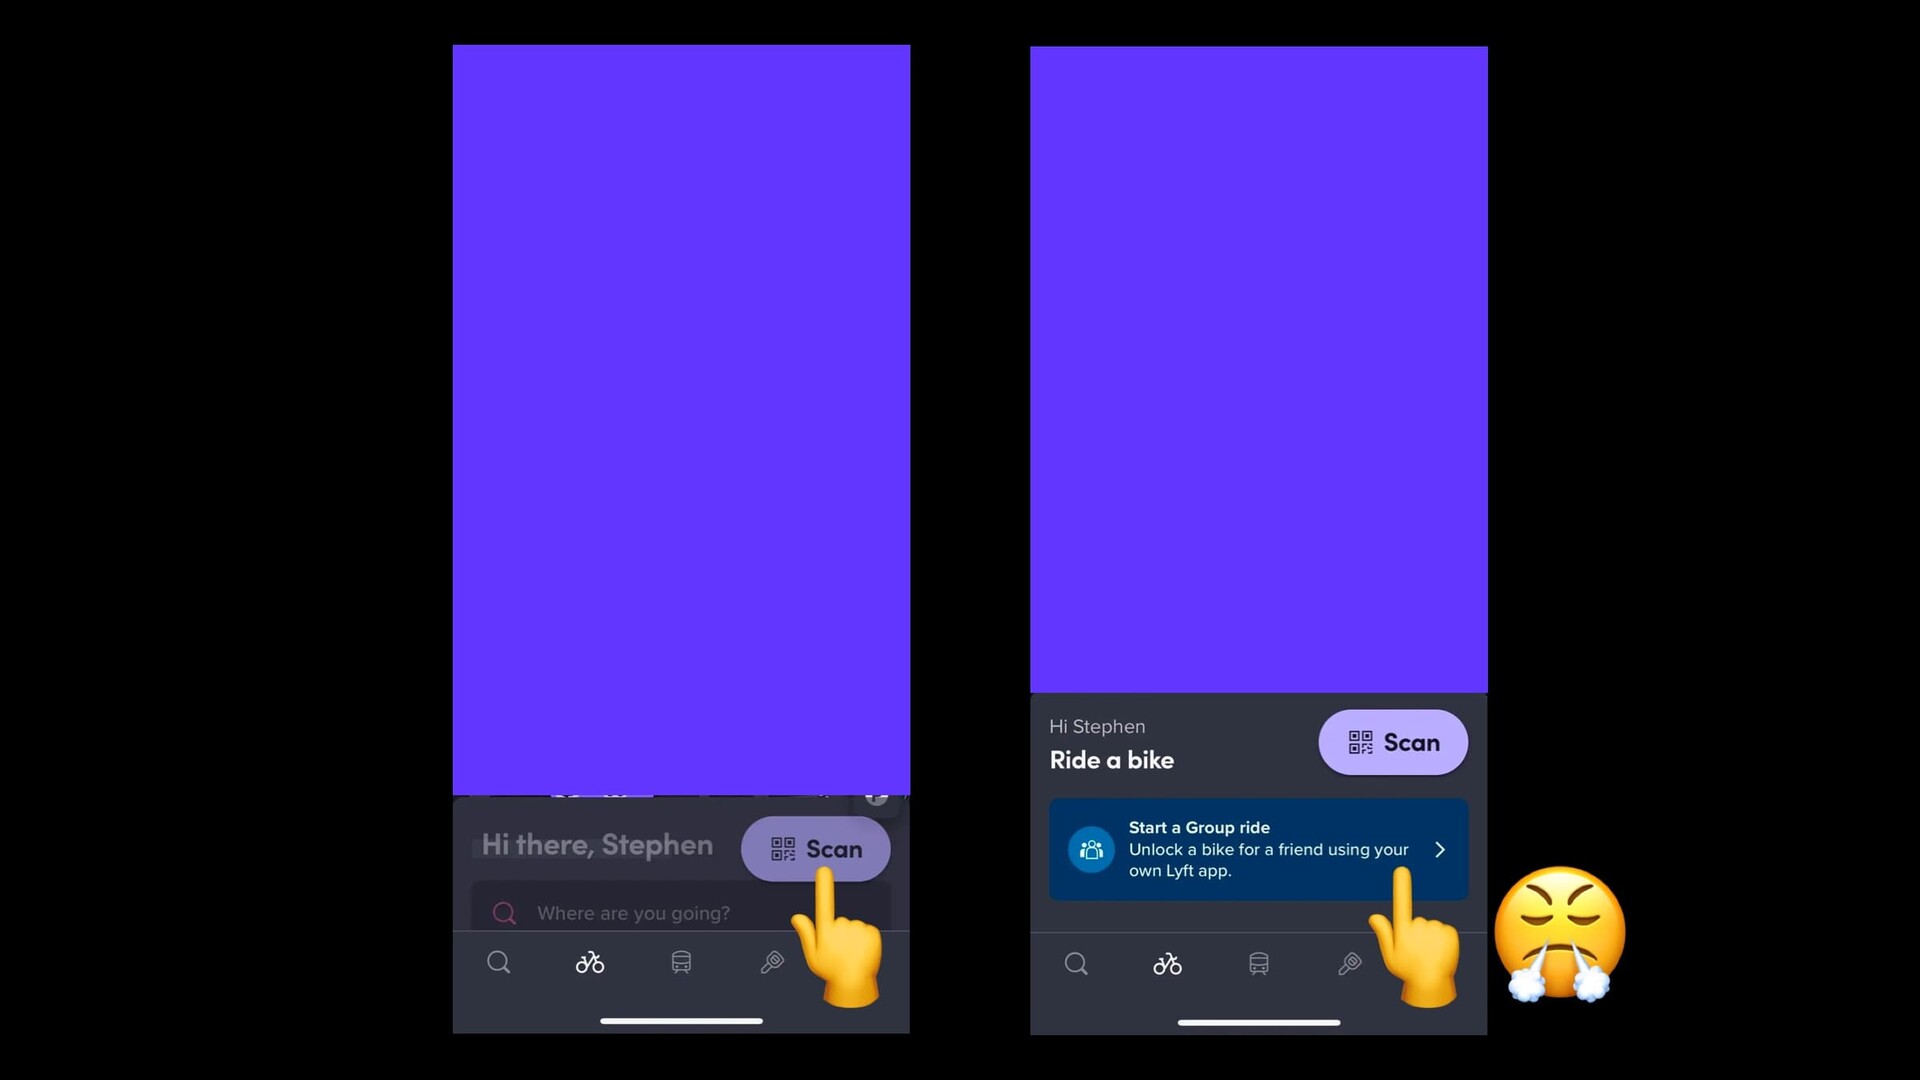


So true
RT @KylePlantEmoji@twitter.com
"the secret scientists don't want you to know!!" Dude have you ever met a single scientist? My scientist friends are desperate for me to know about the changing mating habits of Brown marmorated stink bugs. They're screaming at the top of their lungs to tell you EVERYTHING.
🐦🔗: https://twitter.com/KylePlantEmoji/status/1595564074334576644
About me:
* Electrical engineer (chiphead) by training.
* Software architect/dev-herder (of late) by vocation.
* Computational quantum chemist by avocation.
* Tool-builder by compulsion.
Designed chips, joined/lead a few startups, VC wannabe for awhile. Then the wavefunction collapsed.
Technophile.
Autodidact.
ADHD sufferer/beneficiary.
Burner (the Man).
Dysthymic.
Romantic.
Kitten foster Dad.
I learn differently than others.
#QuantumMechanics #QuantumPhysics #QuantumChemistry #MonteCarloSimulation #ComputerArchitecture #Software
Joined Nov 2022
