

Jack Kennedy 🐀 @_jcken@social.cleverlibre.org
- https://twitter.com/_jcken
I have a stats PhD from Newcastle and work as a senior data scientist at UKHSA
Royal statistical society volunteer
🌲 🐕 🚵♂️ | views own | he/him
Joined Nov 2022
Jack Kennedy 🐀
boosted

I decided to have a little chat with #ChatGPT. Maybe it was the nature of the questions I was asking, but the responses were clear about the limitations of the model and its outputs. I was also pretty impressed with the way it summarised our "conversation" when asked to do so.
As a #journalist and #editor, I can see this sort of text summarisation as being a quite helpful tool when working with, say, a 10,000-word interview transcript
Jack Kennedy 🐀
boosted

Happy 207th birthday to Ada Lovelace!
While often remembered as the first computer programmer, she “drew on many different fields for her innovative work, including languages, music and needlecraft, in addition to mathematical logic.”
She was also a countess. Here’s more of her personal and professional history:
https://theconversation.com/ada-lovelaces-skills-with-language-music-and-needlepoint-contributed-to-her-pioneering-work-in-computing-193930
#OTD #OnThisDay #Programming #ComputerScience #History #WomensHistory
📷: A rare daguerreotype of Lovelace by Antoine Claudet via Wikimedia
so cold here right now that the _inside_ of the car is frozen
Jack Kennedy 🐀
boosted

Got distracted while trying to get #chatGPT to write sample exam questions
@zakvarty It's looking like I'll be handing in the friday before christmas, don't fancy going to the pubs on that day tbh ...
@zakvarty Think I'll just wait post-sub, it's only a few weeks away and I should probably be concentrating on this bastard thesis rather than doing fun stuff!
@zakvarty I really want to update but I'm terrified of ruining _everything_ prior to submission 😬
Jack Kennedy 🐀
boosted


oooh the latest RStudio daily build (v1.3+) supports rainbow syntax highlighting for nested ::: Quarto/pandoc-style divs! #rstats #QuartoPub
@statsrhian ta. if it ends up being a bad idea I'm blaming you
I feel like a hashtag for royal stat soc events/news would be useful for me (and maybe others!) on here. #rss already taken for web stuff. Thoughts?
Free event - Royal Stat soc north eastern local goroup: Data challenges for Fintech companies. 3pm Weds 14th December
Sign up + details: https://rss.org.uk/training-events/events/events-2022/local-groups/data-challenges-for-fintech-companies-(-annual-gen/
@c_borstell Nice! I'd thought about trying to recreate a manhattan/nyc skyline but couldn't figure out what to plot - this works really well
Jack Kennedy 🐀
boosted

This week's #TidyTuesday is elevator data from Hvitfeldt's {elevators} package. I plotted the median speed (in feet per minute) of elevators in NYC by latitude in the style of a skyline with #RStats #tidyverse #ggplot2
Code: https://github.com/borstell/tidytuesday/tree/main/2022/2022-12-06
Jack Kennedy 🐀
boosted

This week's #TidyTuesday data is from the {elevators} package by @emilhvitfeldt looking at elevators in New York City! 🇺🇸 Mostly focused on design this week - inspired by @ldbailey255 to make a custom legend 🎨
Code: https://github.com/nrennie/tidytuesday/tree/main/2022/2022-12-06
and here's {vapoRwave}
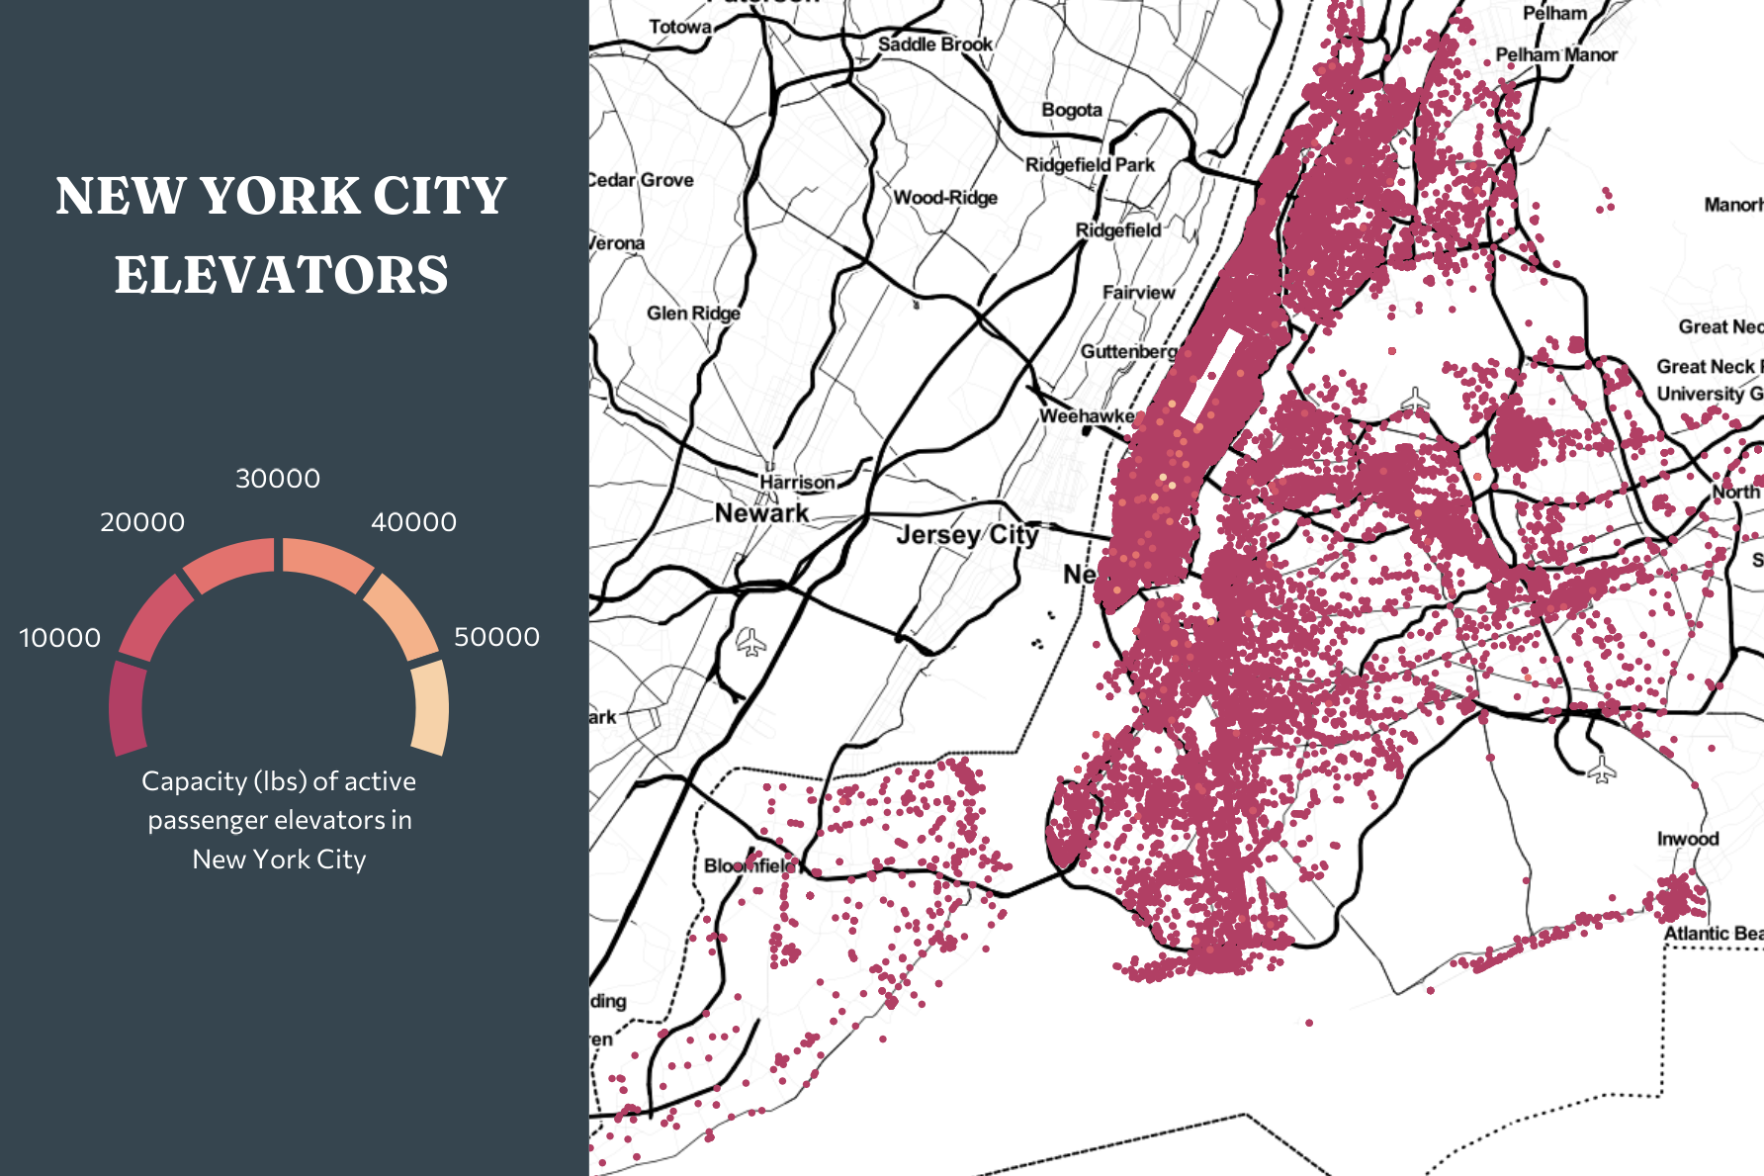
Wasn't really sure what to do with the elevator data for #TidyTuesday. I had recently come across {vapoRwave} for a e s t h e t i c themes and pallets, I thought I'd try plotting a retro video game style map
code: https://github.com/jcken95/tidytuesday/tree/main/2022/2022-12-06
Jack Kennedy 🐀
boosted

I had a lot of fun dorking out for a good cause. Here's a revival of my "how to name files" advice as a 5-minute ⚡ talk for #NormConf.
You should have a look at the whole collection of ⚡ talks -- fantastic and fun and short!
@gianlubaio that's why I said specify "your priors"! my guess is AI would likely specify either x~N(0,1) or x~N(0, 10^k) with k>4
Jack Kennedy 🐀
boosted


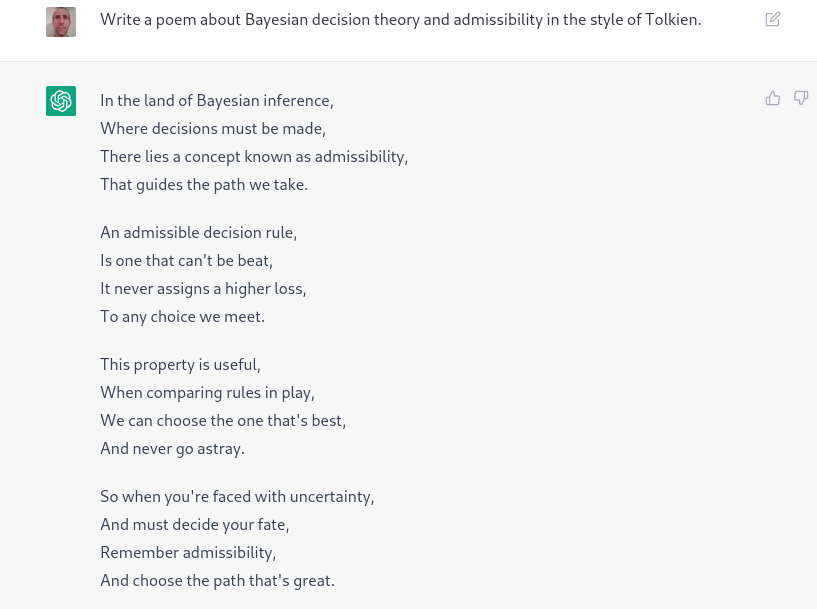



now ChatGPT seems really impressive and all but you have to remember that you can be tricked into thinking a rock has feelings by drawing a cute face on it
- https://twitter.com/_jcken
I have a stats PhD from Newcastle and work as a senior data scientist at UKHSA
Royal statistical society volunteer
🌲 🐕 🚵♂️ | views own | he/him
Joined Nov 2022
