

Jack Kennedy 🐀 @_jcken@social.cleverlibre.org
- https://twitter.com/_jcken
I have a stats PhD from Newcastle and work as a senior data scientist at UKHSA
Royal statistical society volunteer
🌲 🐕 🚵♂️ | views own | he/him
Joined Nov 2022
Jack Kennedy 🐀
boosted

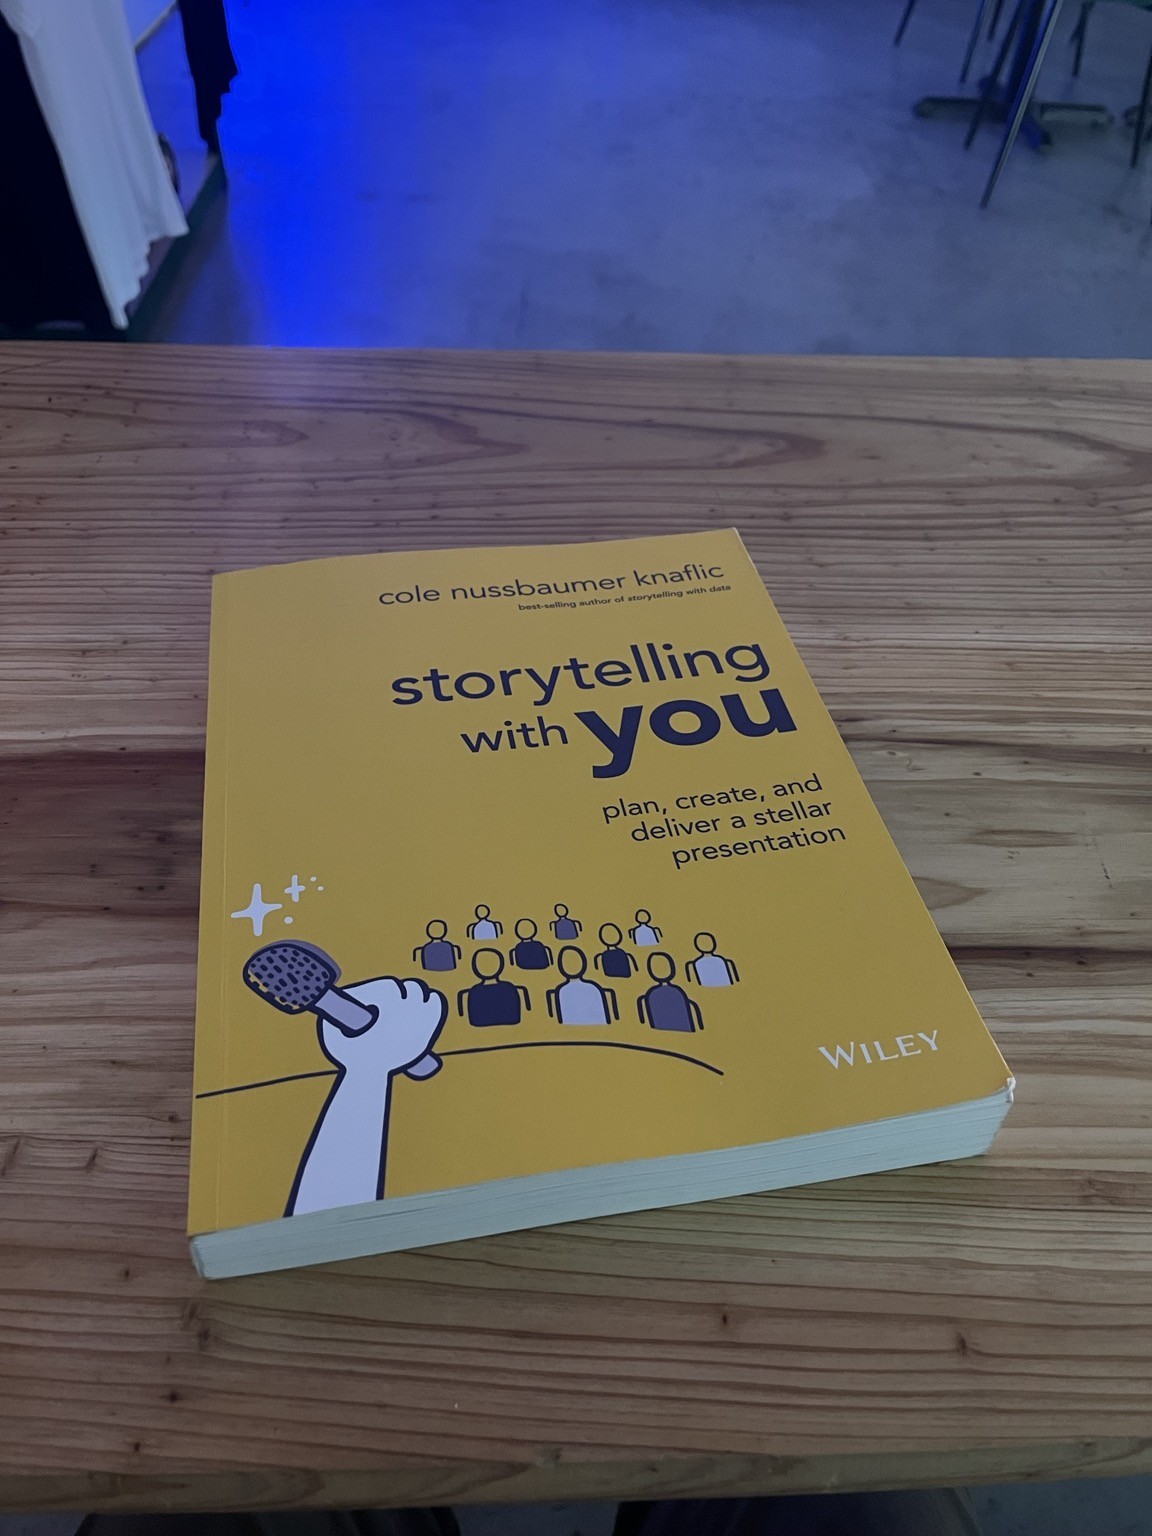
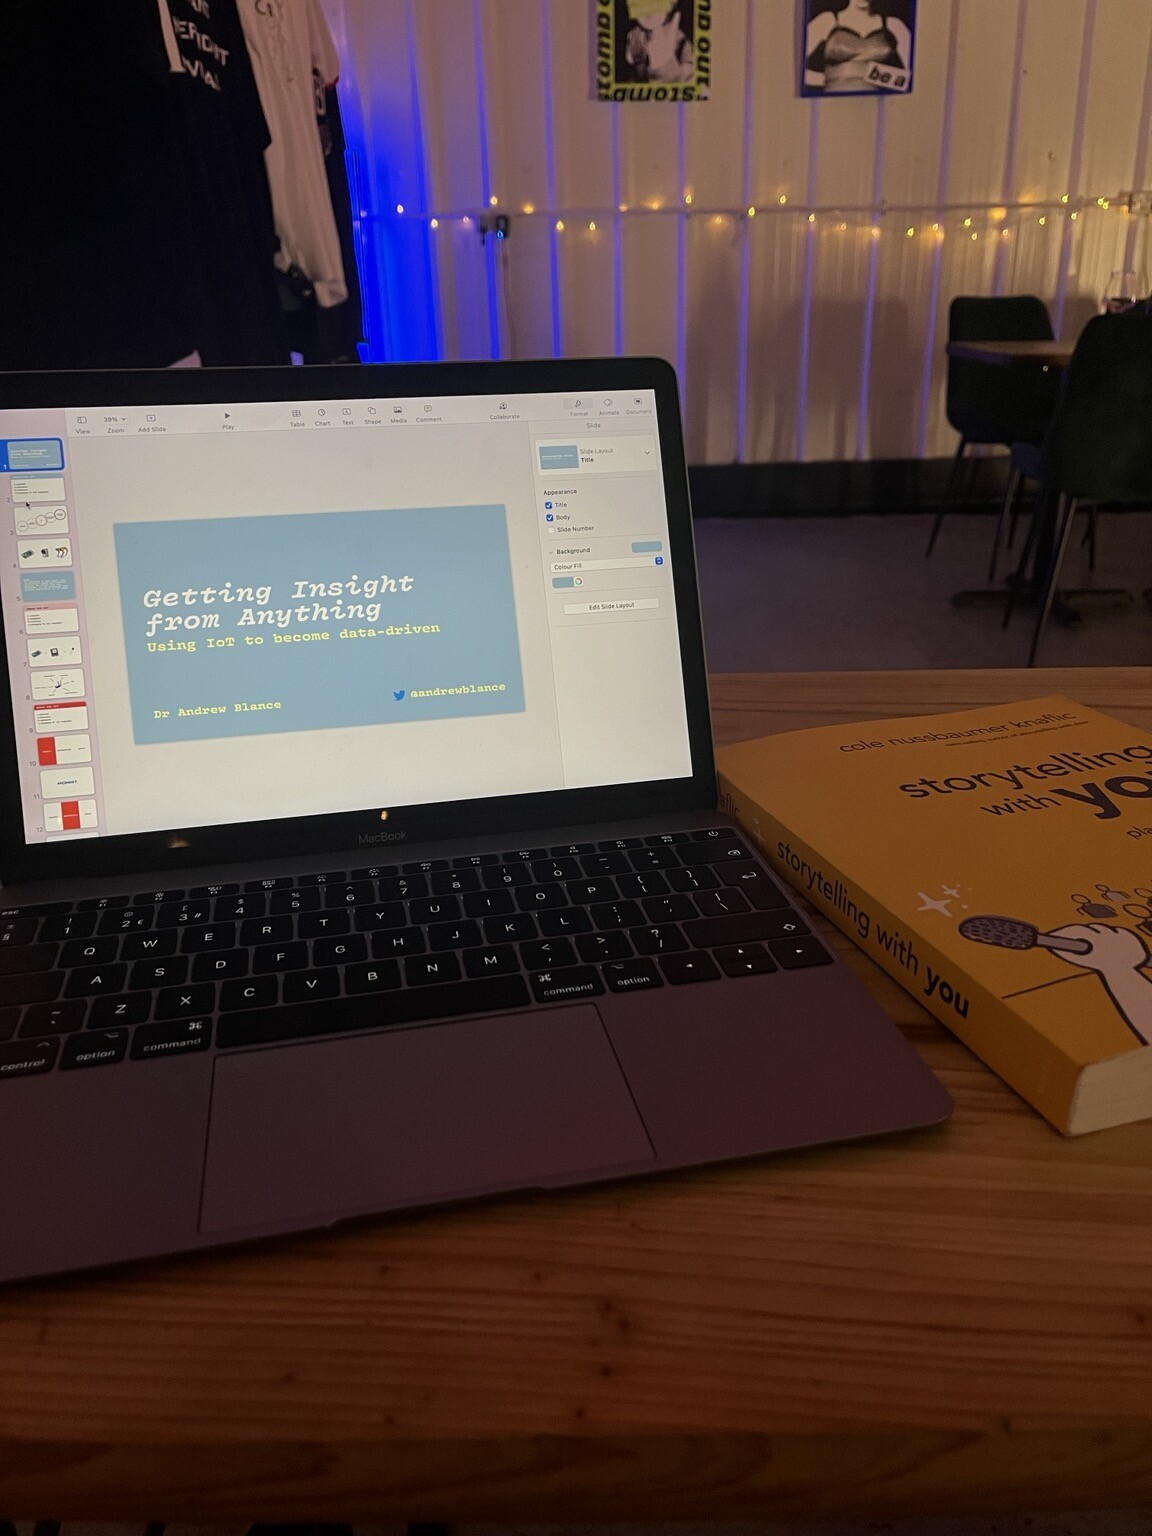
Getting ready for my #northeast #datascience #meetup talk by re-reading Cole Knaflic’s super book Storytelling with You!
This is the first talk I’ve given after reading it, the book is having a biggg impact on how I’m preparing. Lots of actionable, useful advice!
Also I use a really nice font for my slides (vulf mono), so im excited to show that off
Jack Kennedy 🐀
boosted


Jack Kennedy 🐀
boosted

Right then, finally an #introduction post for me.
I am #Irish, but live in #Bristol (UK).
I am an applied statistician working in academia, mainly teaching #rstats at undergraduate and postgraduate level.
I'm a statistical ambassador for the Royal Statistical Society https://rss.org.uk/membership/promoting-statistics/rss-statistical-ambassadors/
I have been involved in running the European Juggling Convention each year since 2005 - occasionally on the organising team. Summer 2023 it's back in Ireland in #Gormanston
bought a new wheelset in anger. quite nice to have hubs that don't rumble like a washing machine #BikeTooter
Jack Kennedy 🐀
boosted

My #data story today is about https://realworlddatascience.net/, the new #datascience site I'm building at the Royal Statistical Society.
We're looking to publish:
- case studies
- explainers
- exercises
- advice
- career profiles
- interviews
for #datascience students, practitioners, leaders and educators. We want it to be a space where people can share, learn about and be inspired by real-world uses of #datascience.
If you'd like to be involved, please get in touch.
Source: https://realworlddatascience.net/contributor-docs/call-for-contributions.html
Jack Kennedy 🐀
boosted

I saw another "for loops in #rstats are bad" take on the bird site this afternoon.
Just pre-allocate your vectors, folks! All is well!
Jack Kennedy 🐀
boosted
I had to do a bit of a hack to get a youtube video to embed into quarto (html output) slides - just inserting it into the raw html after compiling.
Can anyone point to a successful implementation of embedding youtube videos into quarto slides?
Using a html code block didn't work (and I was making the slides last minute, so didn't have much time for faff).
It does! Rendering can be slow/buggy though ...
Apparently QOTO allows #LaTeX? \( e^{i \theta} = \cos ( \theta) + i \sin (\theta) \)
Jack Kennedy 🐀
boosted

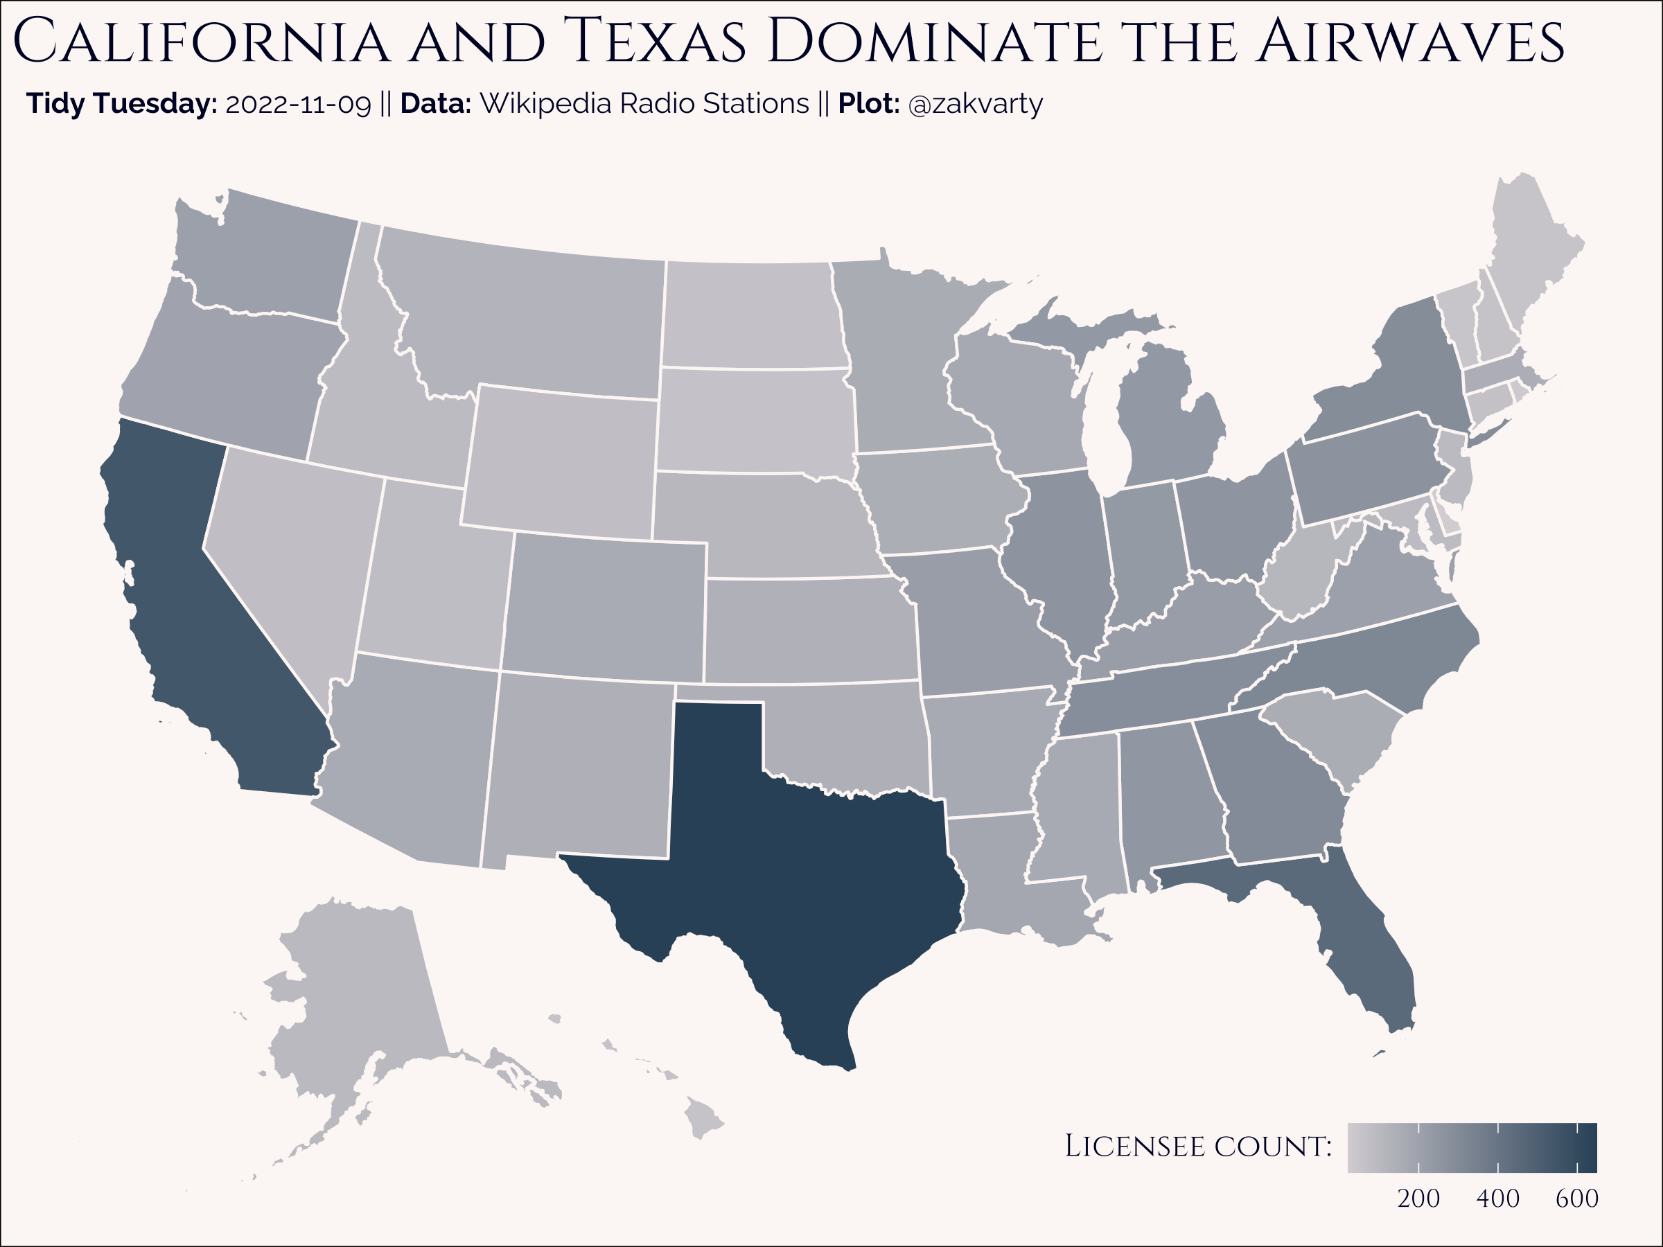
This week's #TidyTuesday is on US radio stations. 📻
It's my first attempt at using mapping using #ggplot, so I focused on making something aesthethically pleasing rather than statistically interesting.
This taught me a lot, including custom colour scales and legend placement.
Code: https://github.com/zakvarty/tidy-tuesday/tree/main/2022/2022-11-08
Jack Kennedy 🐀
boosted

Please make sure to add alt text to your images. I don't know how to enforce that in our instance but it should be something that we're all cognizant of each time we post images.
Jack Kennedy 🐀
boosted

Inspired by Calle Börstell to make something akin to radio dials for this week's #TidyTuesday dataset on radio stations in the USA!
Thanks to Frank Hull and Erin for the data this week!
Code: https://github.com/nrennie/tidytuesday/tree/main/2022/2022-11-08
#rstats #r4ds #DataViz #DataVisualisation #DataVizualisation
#TidyTuesday this week is about radio stations in the US
Turns out, the proportion of stations within a state that play Gospel music (left) is strongly linked to the Bible Belt states (right)
Code: https://github.com/jcken95/tidytuesday/tree/main/2022/2022-11-08
Jack Kennedy 🐀
boosted






🤓 I'm a PhD student in #stats but will be starting an industry #datascience role soon! I'm also highly active in the royal statistical society, mainly supporting early career stats & DS 🐤
🐘 I'll be tooting about #rstats & DS and maybe contributing to #BikeTooter 🚲
- https://twitter.com/_jcken
I have a stats PhD from Newcastle and work as a senior data scientist at UKHSA
Royal statistical society volunteer
🌲 🐕 🚵♂️ | views own | he/him
Joined Nov 2022
