

Jack Kennedy 🐀 @_jcken@social.cleverlibre.org
- https://twitter.com/_jcken
I have a stats PhD from Newcastle and work as a senior data scientist at UKHSA
Royal statistical society volunteer
🌲 🐕 🚵♂️ | views own | he/him
Joined Nov 2022
Jack Kennedy 🐀
boosted

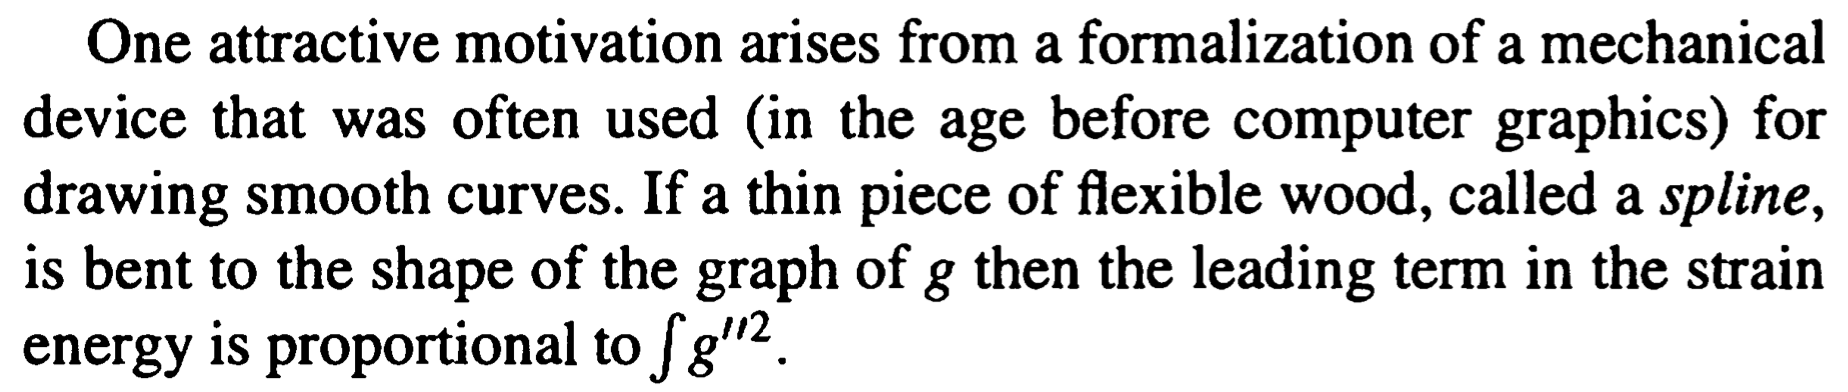
Didn't know this specific reasoning for the term 'splines' in regression, but it makes a lot of sense!
Jack Kennedy 🐀
boosted

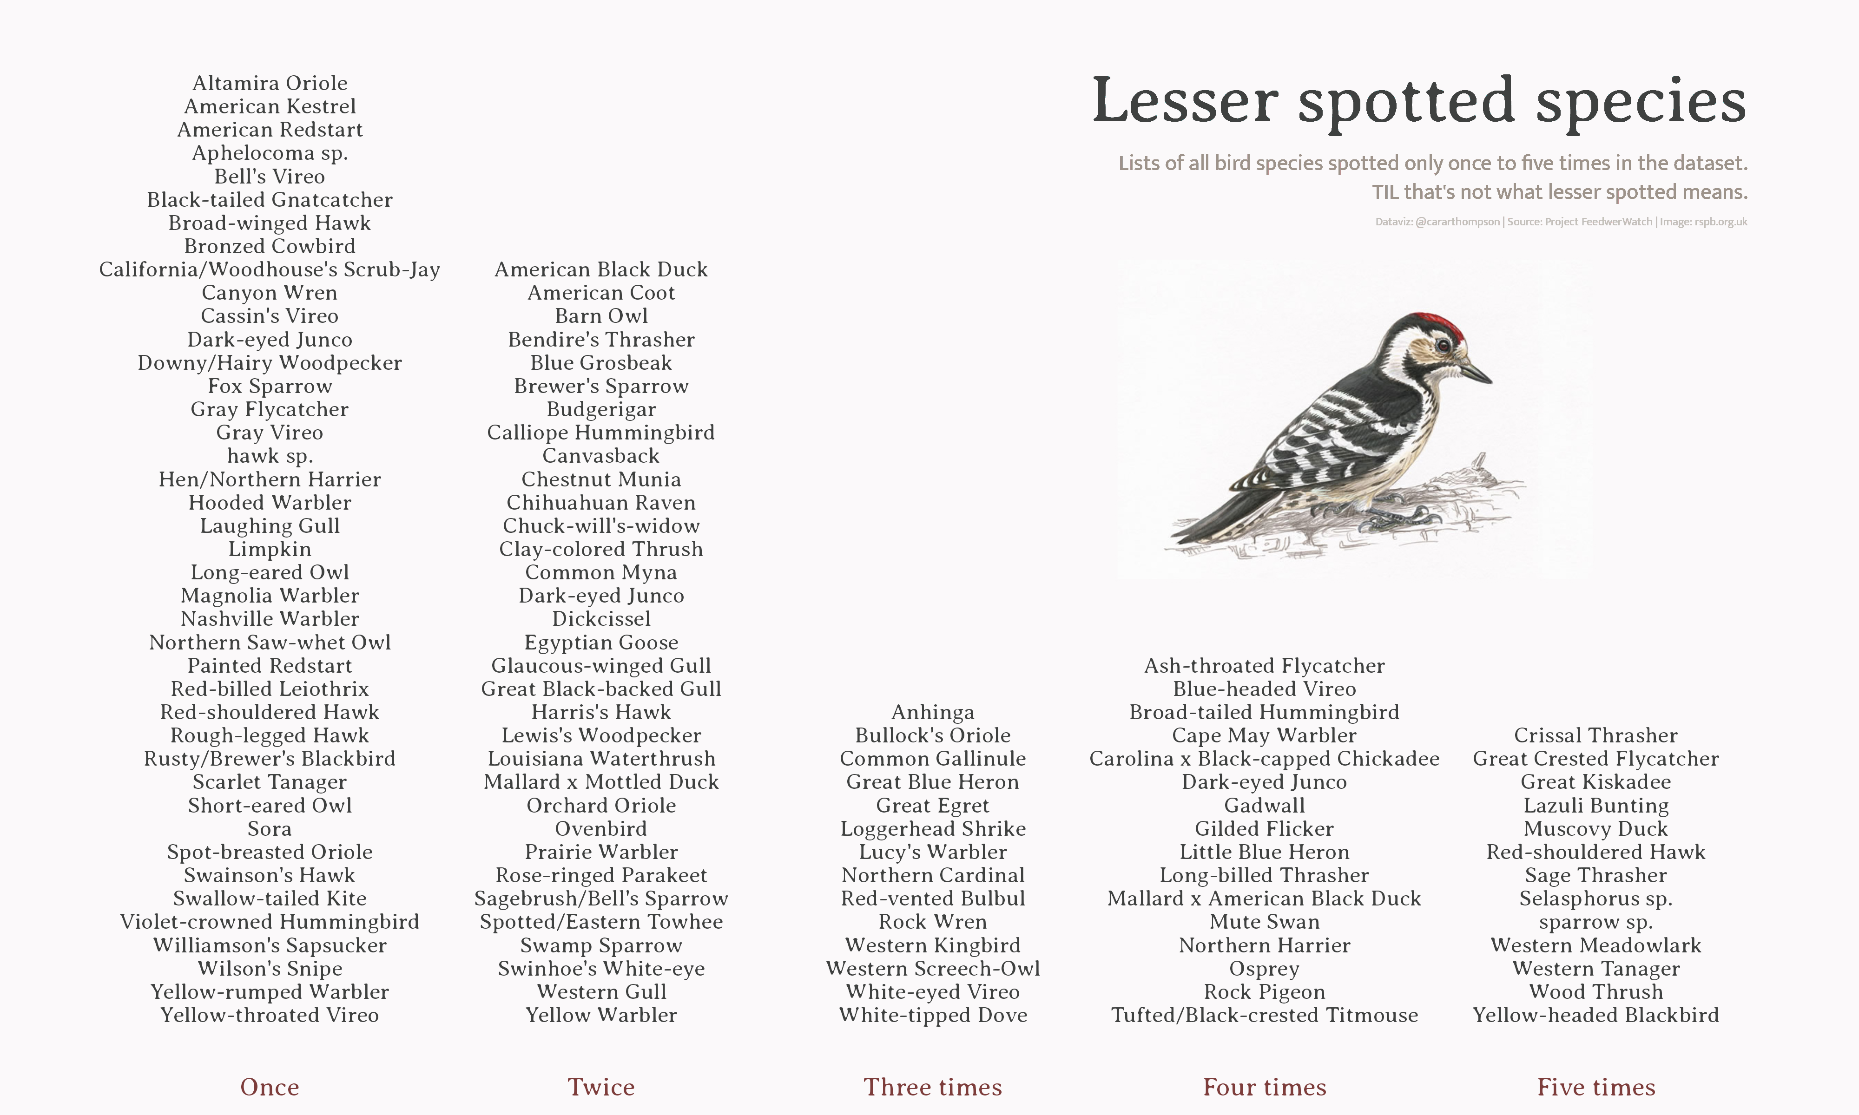
For this week's #TidyTuesday I explored the "lesser spotted" birds in the Project FeederWatch dataset... and also learnt that that's not what lesser spotted means.
I had wanted to add one of these plots to my portfolio for a while!
A lot of data for this week's #TidyTuesday about bird sightings in 2020-2021 in the USA. Recycled some code from last week to produce a bar chart to show which habitats have the most birds
Jack Kennedy 🐀
boosted

This week we continue our series on end-to-end #testing with {shinytest2}!
✨ In part 2 of the series, we will write a simple #RShiny app (as an #RStats package) and show how to generate tests for this app using {shinytest2} ✨
https://www.jumpingrivers.com/blog/end-to-end-testing-shinytest2-part-2/
Jack Kennedy 🐀
boosted

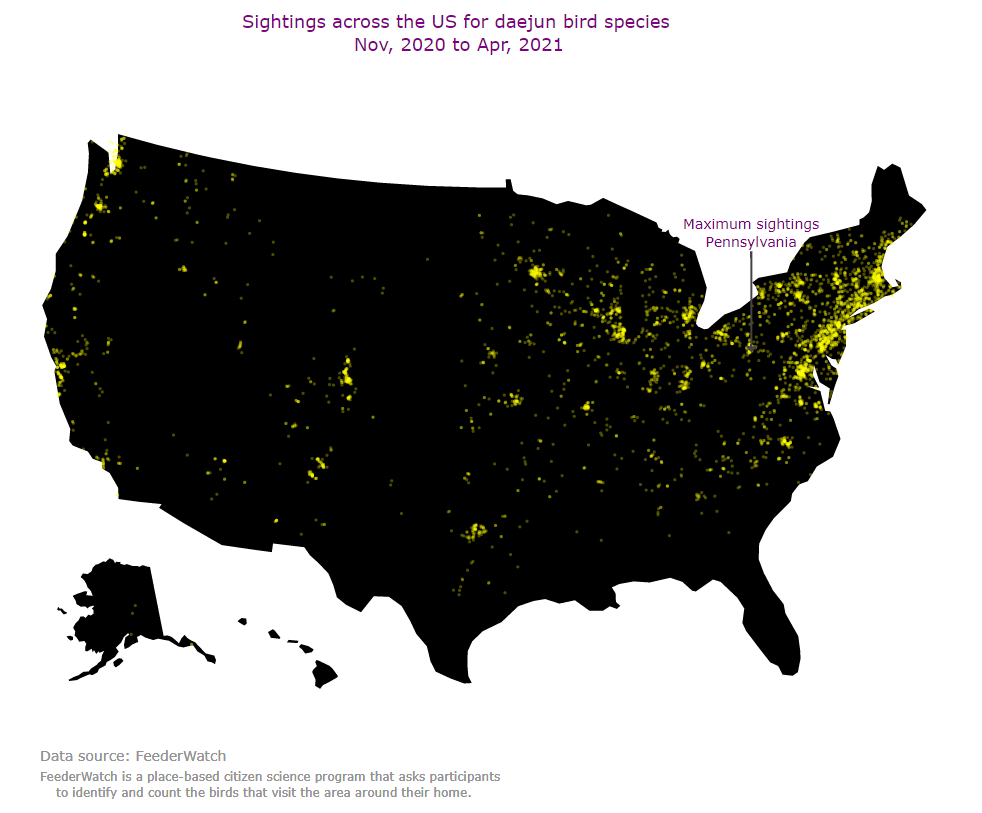
This week's #TidyTuesday data is from FeederWatch, a citizen science program that asks participants to identify and count the birds that visit the area around their home.
code: https://github.com/deepshamenghani/tidytuesday/tree/master/2023/Week2_birdfeeder
Jack Kennedy 🐀
boosted
The new {eyedroppeR} package from @danoehm lets you pick colours from any image and return the hex in #RStats!
👀 Check it out 👀 on GitHub: https://github.com/doehm/eyedroppeR
Jack Kennedy 🐀
boosted

Happy new year, all! For 2023, why not make a resolution to contribute to @rwdatasci?
• Submit a case study: https://realworlddatascience.net/contributor-docs/case-studies.html
• Explain a statistical idea all #datascientists need to know: https://realworlddatascience.net/news-and-views/editors-blog/posts/2022-12-01-themes/themes.html#statistical-ideas-all-data-scientists-need-to-know
• Design an exercise or challenge to help students and practitioners hone their skills: https://realworlddatascience.net/contributor-docs/exercises.html
• Write a digestible summary of a new #datascience research paper: https://realworlddatascience.net/contributor-docs/datasciencebites.html
my favourite thing about a fresh ubuntu install is having to install all the system dependencies for stuff I want to use
Jack Kennedy 🐀
boosted

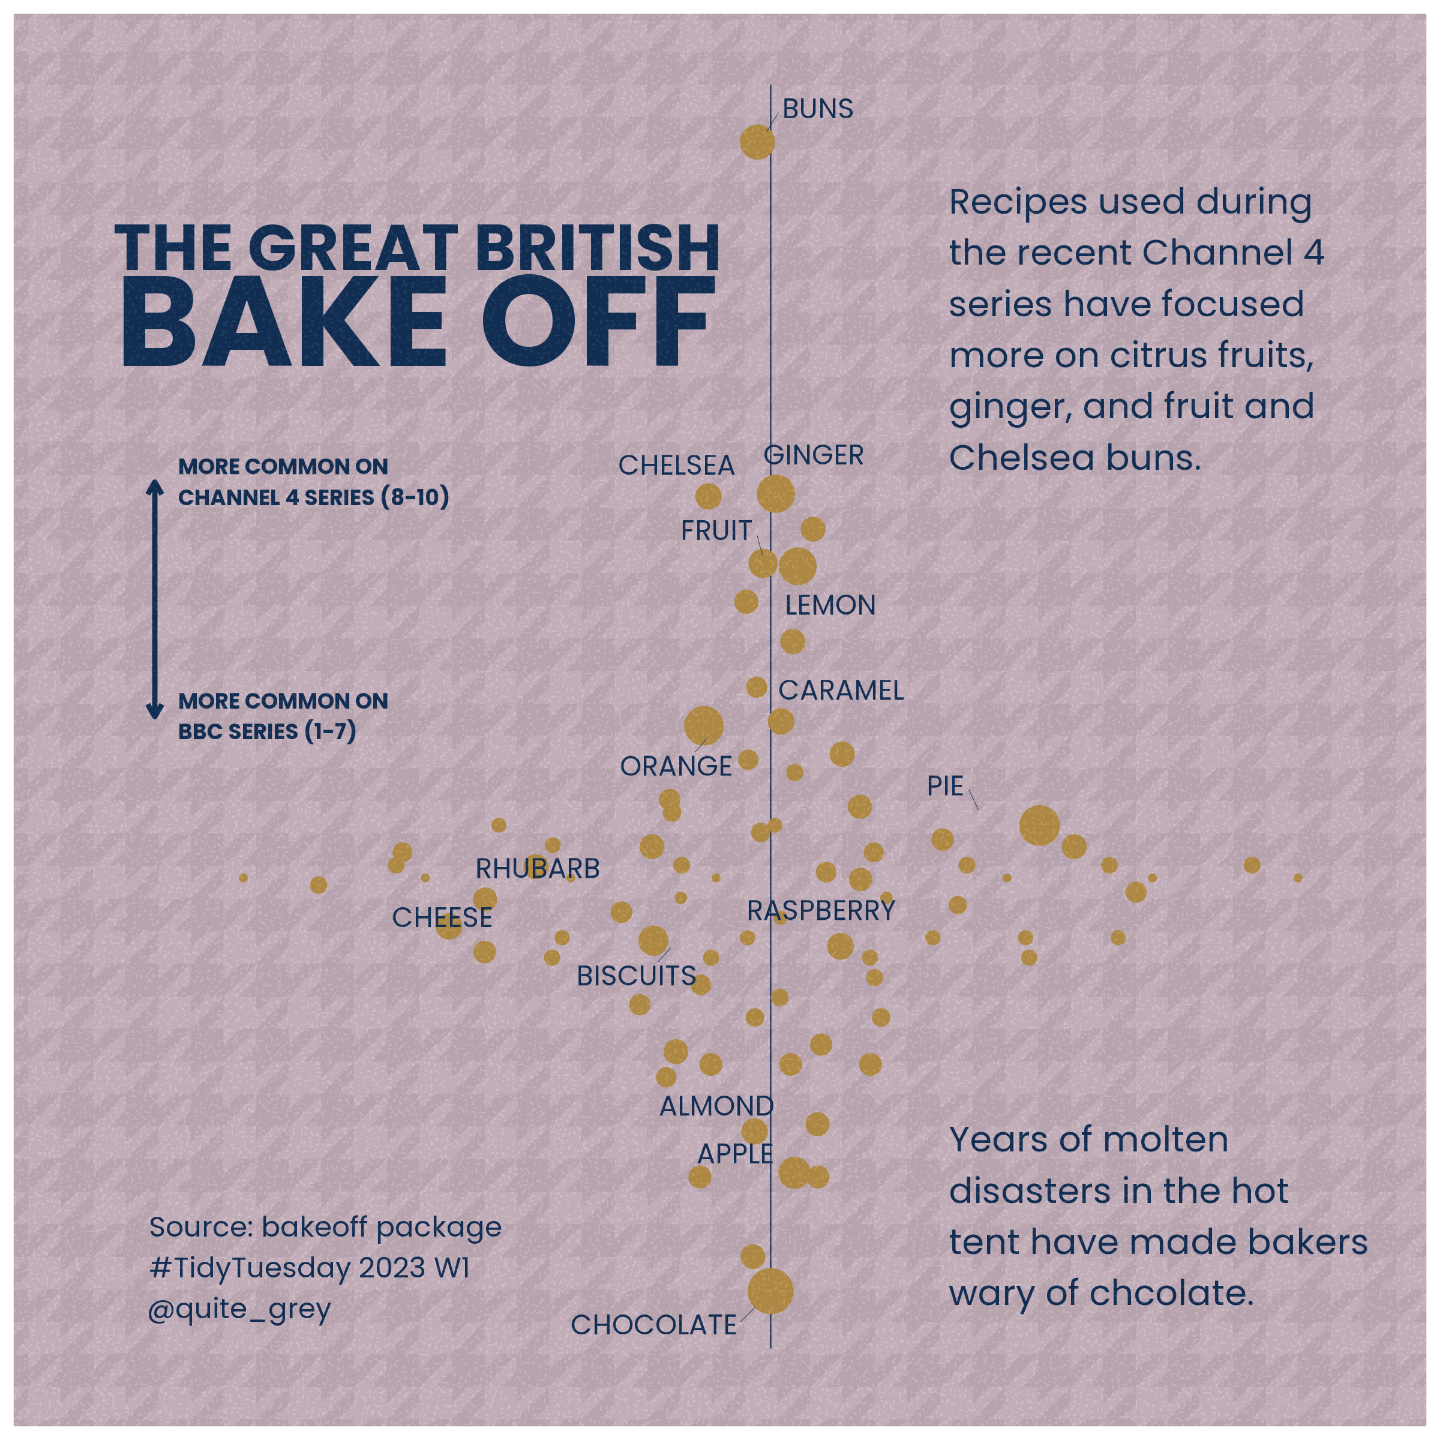
A catch up on one of last year's data sets from R's bakeoff package, which has a lot of data on The Great British Bake Off. Bakers have learned that chocolate and hot tents don't mix, but citrus fruit and ginger does.
Jack Kennedy 🐀
boosted

@_jcken my protanopic eyes find the text colour on this really hard to read!
Here's what I'm told is a simulation of what I see
I also lifted a bit of code from Albert Rapp's blog to clean up the bar charts (put word within the bar, for ex). AR's blog post: https://albert-rapp.de/posts/ggplot2-tips/16_bars_checklist/16_bars_checklist.html
For #TidyTuesday bring your own data week I constructed a quick summary of my thesis - the 10 most commonly used words. "Approach" is the only non-technical word in this list, perhaps I should have looked for synonyms
Code: https://github.com/jcken95/tidytuesday/tree/main/2023/2023-01-03
The code includes the script I used to generate the data, but I haven't included my thesis because I don't think my examiner will have it yet! I have however included a permuted version of my thesis, so you should be able to recreate the viz
Jack Kennedy 🐀
boosted

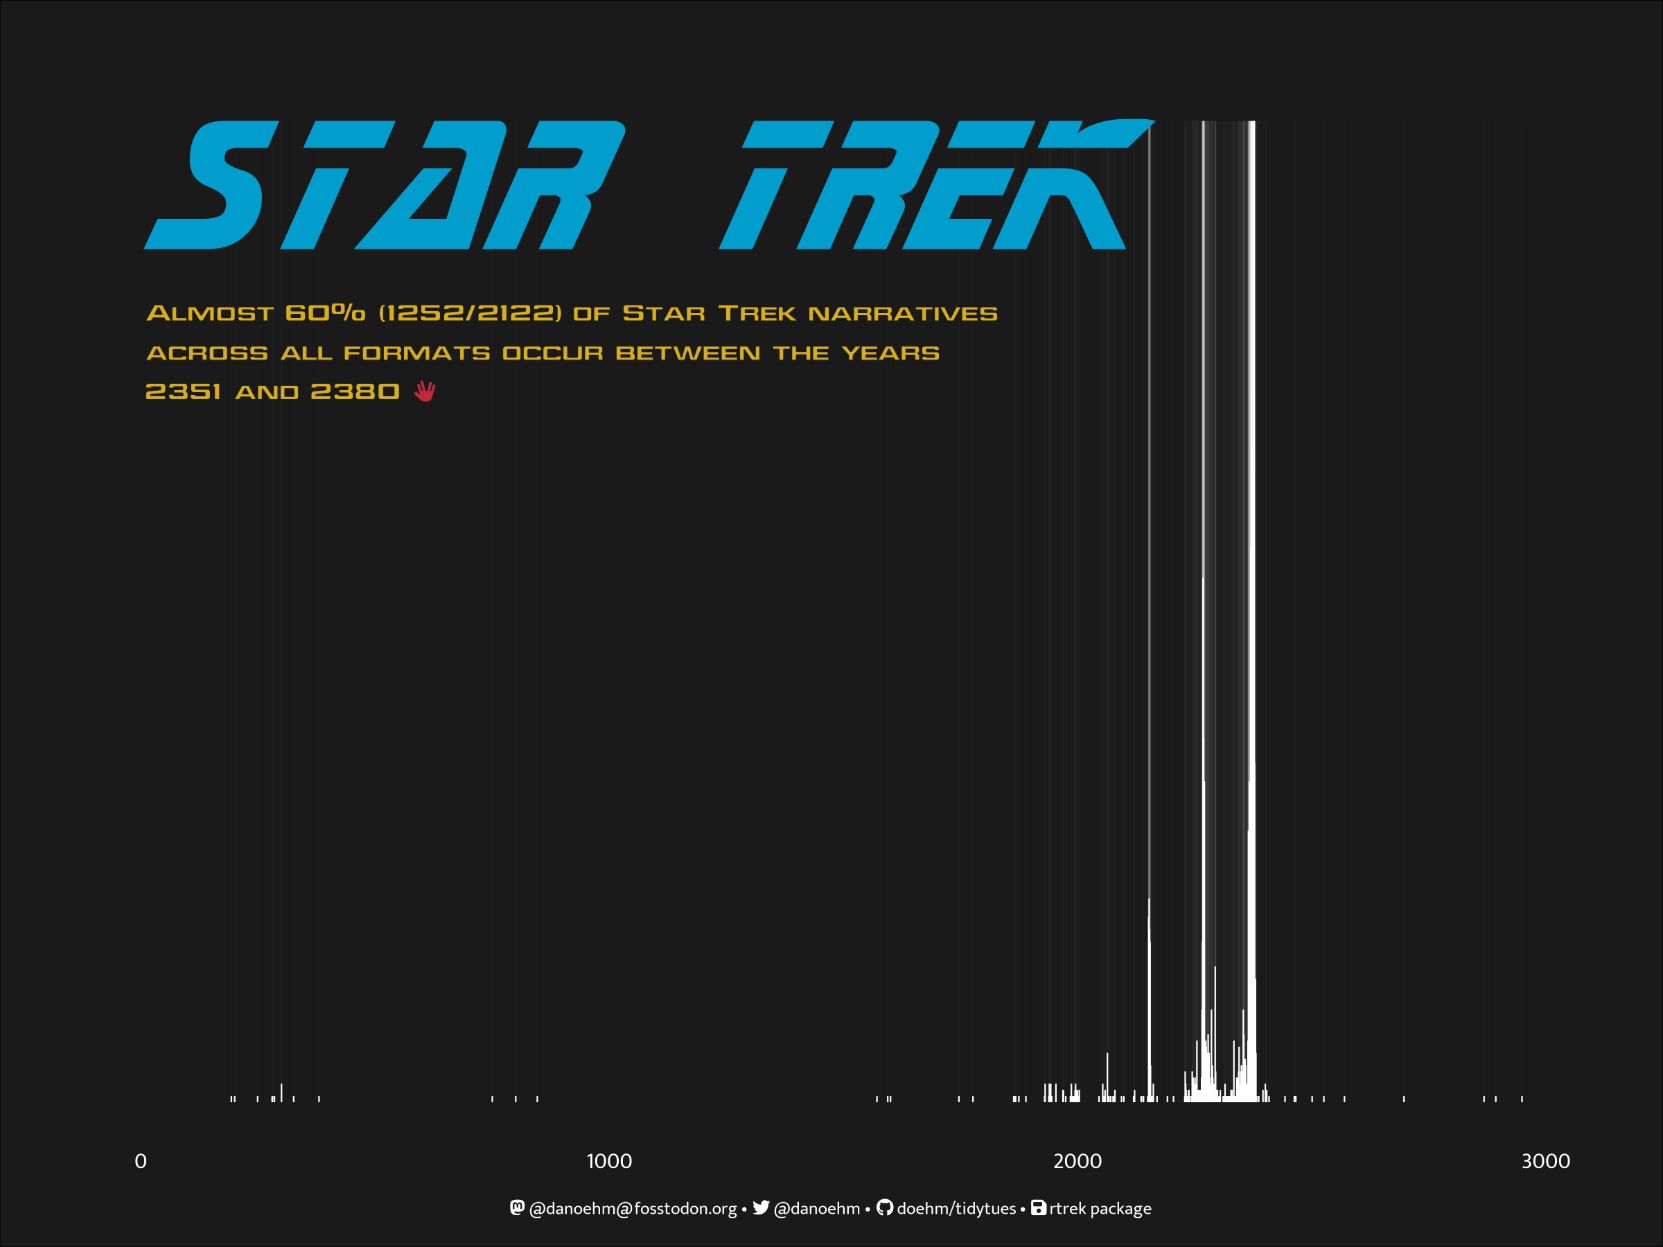
#TidyTuesday week 52: Star Trek 🖖
Almost 60% of Star Trek narratives occur between the years 2351 and 2380
✅ A full year of Tidy Tuesday complete!
Jack Kennedy 🐀
boosted

I made an example of how implementations of user defined probability functions in Stan can be tested in the generated quantities block. This is a much faster and easier approach to see implementation errors than by running MCMC.
See more in Stan Discourse post https://discourse.mc-stan.org/t/testing-user-defined-probability-function-implementations-in-stan-generated-quantities/29907
Jack Kennedy 🐀
boosted

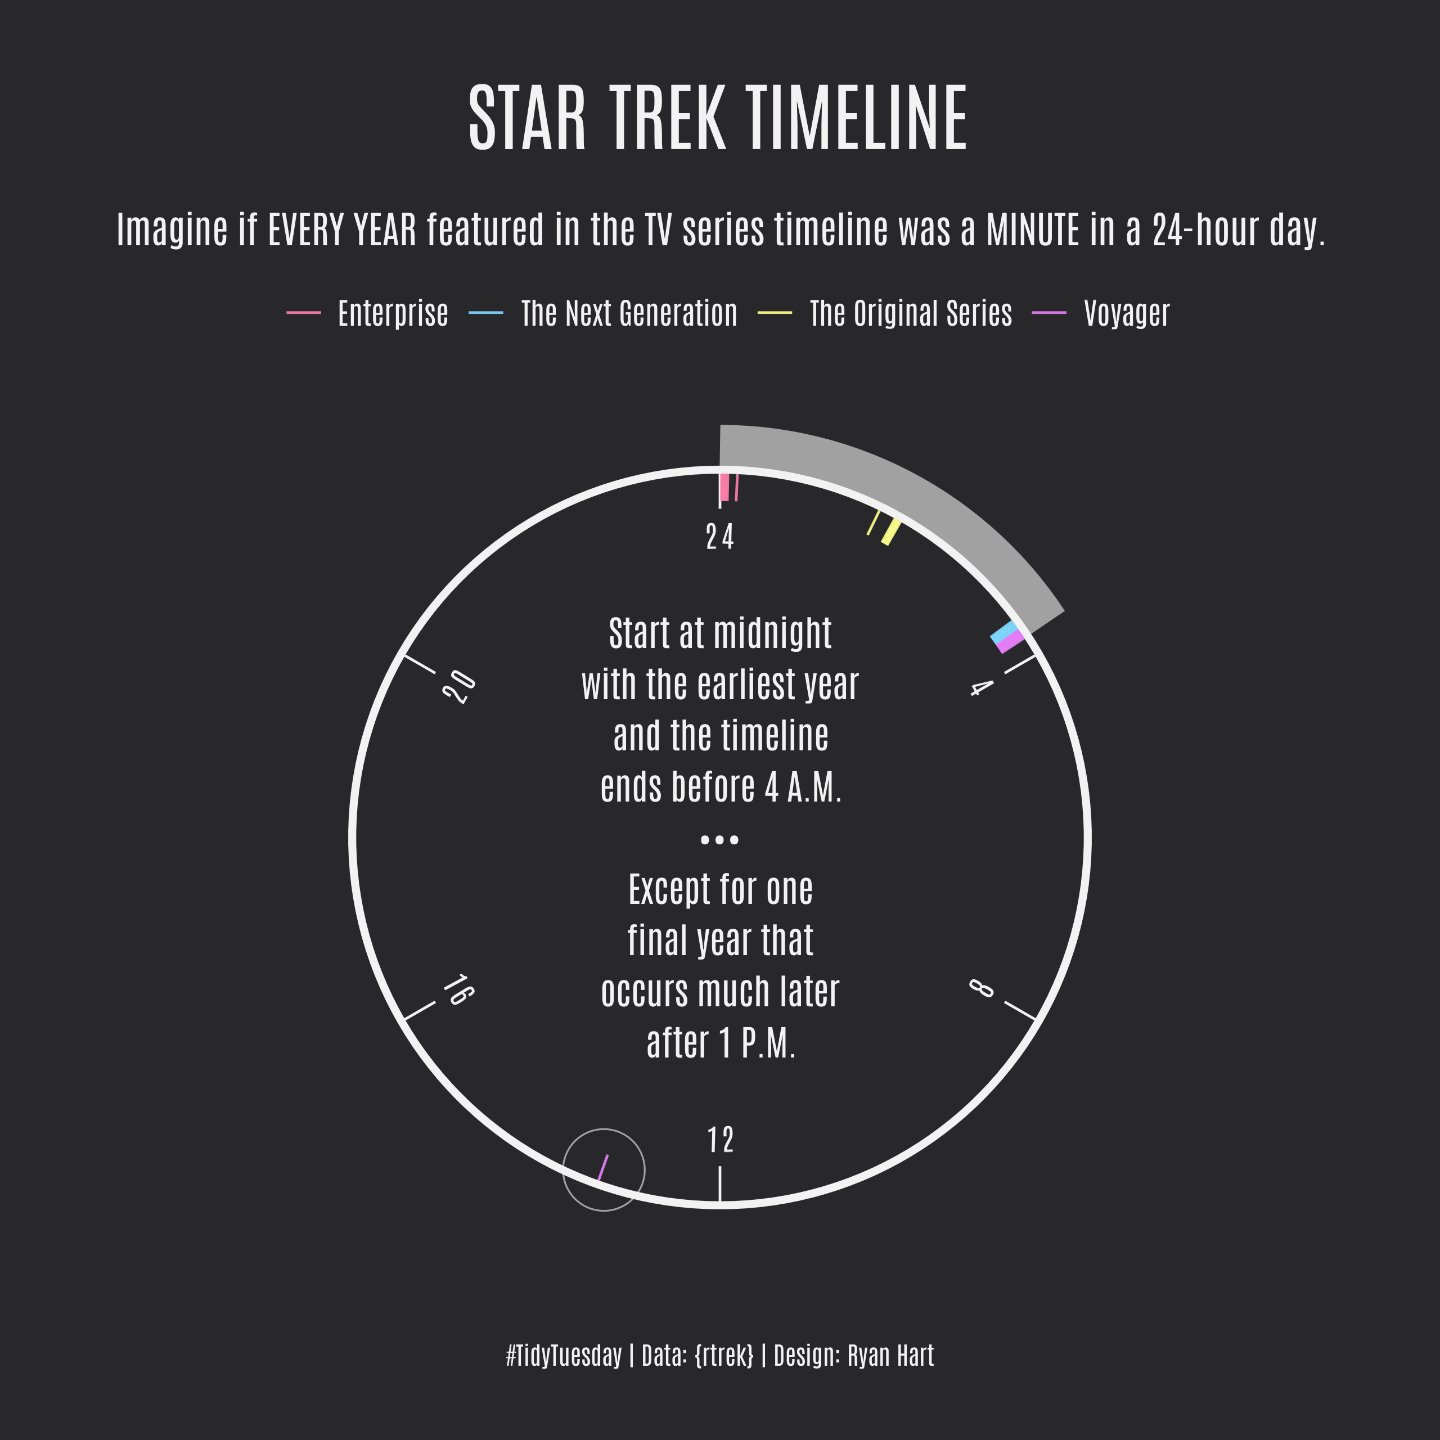
#TidyTuesday | Week 52 | Star Trek
One episode went farther into the future "where no man has gone before."
code: https://github.com/curatedmess/TidyTuesday/blob/main/2022/12272022/star_trek_timeline.R
visiting family in morecambe for Christmas, which is where I grew up. amazing to see that despite everything that has changed, all the tat/bargain shops still remain from 20 years ago
Jack Kennedy 🐀
boosted

Jack Kennedy 🐀
boosted






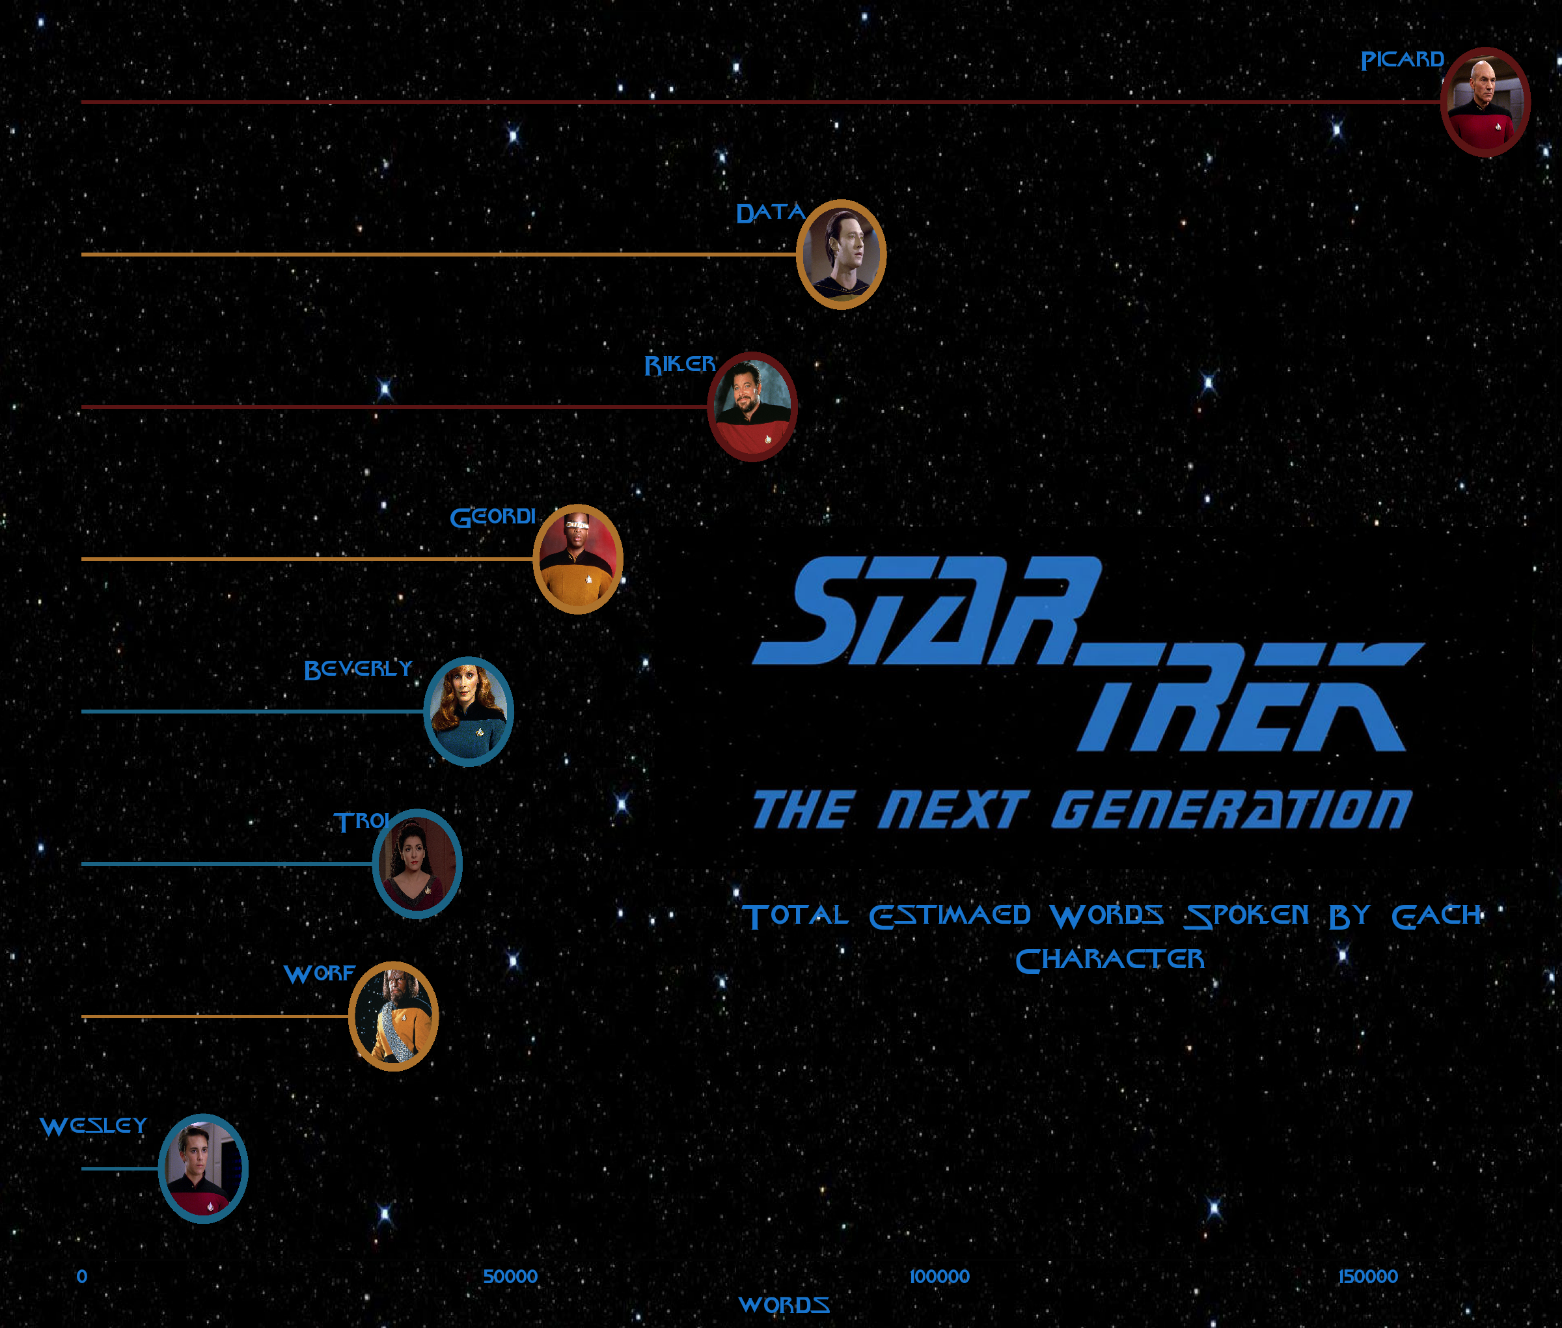
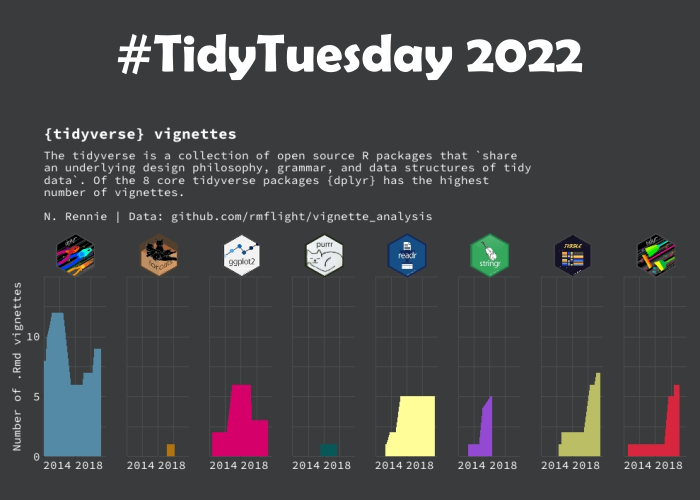
My last blog post of 2022! A recap of another year of #TidyTuesday contributions - including some new things I've learned and some resources to help you get started with data visualisation in R!
https://nrennie.rbind.io/blog/2022-12-27-another-year-of-tidytuesday/
- https://twitter.com/_jcken
I have a stats PhD from Newcastle and work as a senior data scientist at UKHSA
Royal statistical society volunteer
🌲 🐕 🚵♂️ | views own | he/him
Joined Nov 2022
