

Jack Kennedy 🐀 @_jcken@social.cleverlibre.org
- https://twitter.com/_jcken
I have a stats PhD from Newcastle and work as a senior data scientist at UKHSA
Royal statistical society volunteer
🌲 🐕 🚵♂️ | views own | he/him
Joined Nov 2022
Jack Kennedy 🐀
boosted

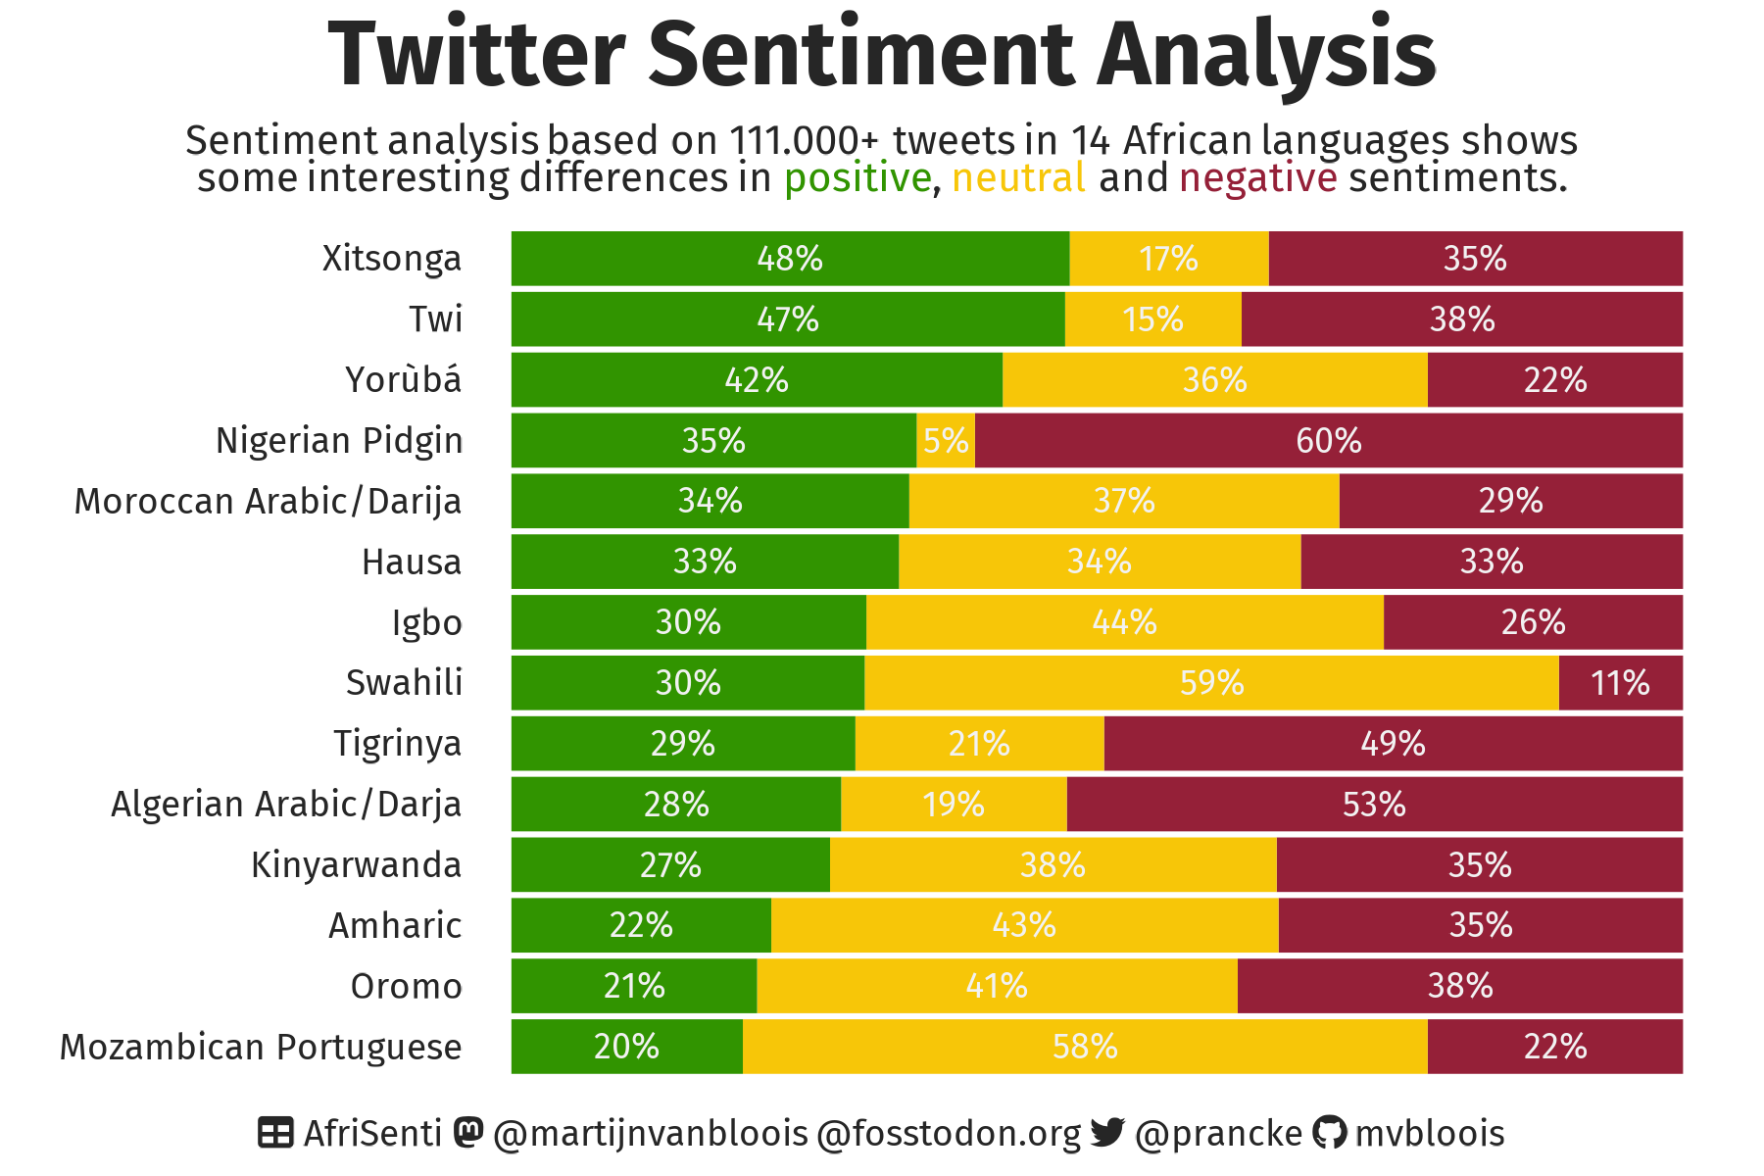
This week we look at sentiment analysis in 14 African languages. #TidyTuesday
Special thanks to @Shmuhammadd for providing the datasets. Read his paper at https://arxiv.org/pdf/2302.08956.pdf
Jack Kennedy 🐀
boosted

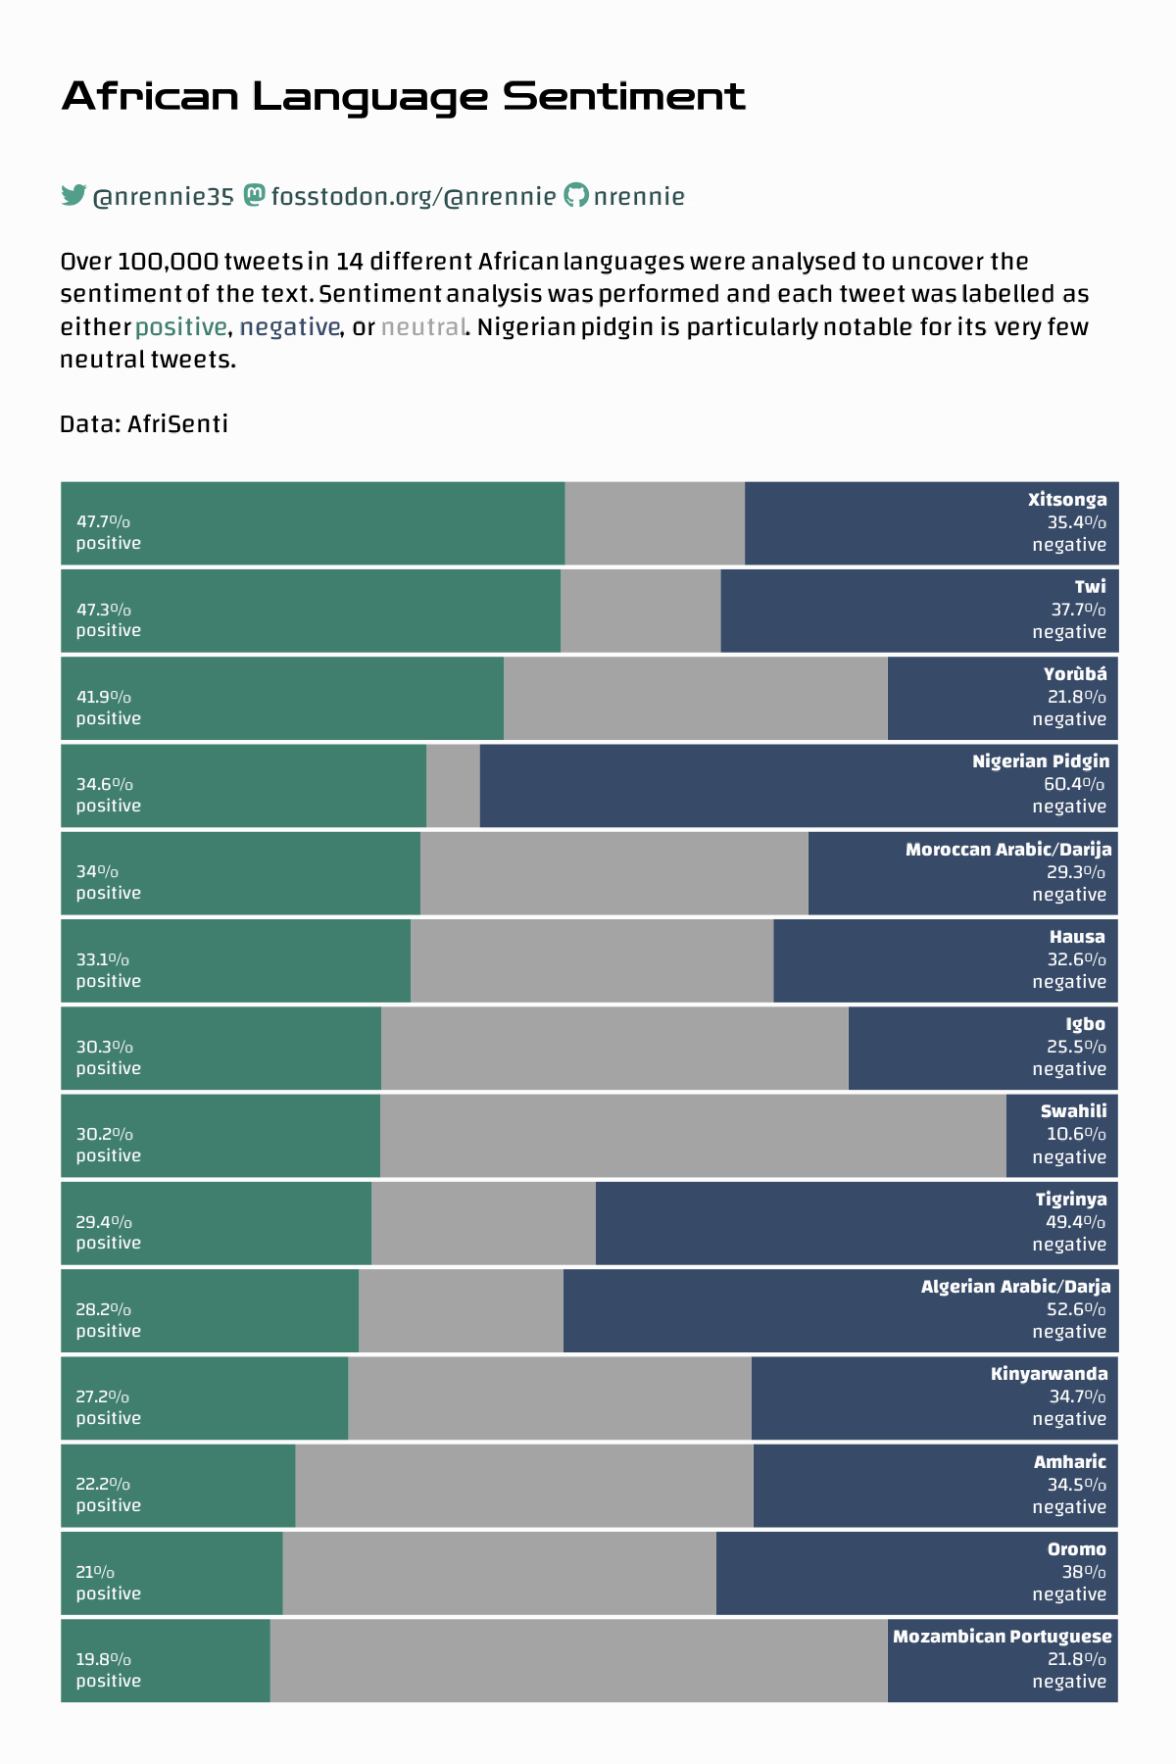
It's #TidyTuesday again! Thanks to Shamsuddeen Hassan Muhammad for sharing the data this week on African language sentiments 🌍
I made use of {ggtext} again this week to try some alternative approaches to labelling bar charts! 📊
Code: https://github.com/nrennie/tidytuesday/tree/main/2023/2023-02-28
Jack Kennedy 🐀
boosted

Suppose, in a #QuartoPub document, using #rStats I have a list of length G, each item in this list is a flextable - I need to use flextable as opposed to kable, to allow for output to docx.
G is unknown apriori, but will be at least 1.
Is there any way to create a sequence of tables with associated labels and captions that could be worked out dynamically/parsed?
Manually, this can be done really easily (creating new labels etc) and knowing when to stop, but is there a way of automating this?
A paper of mine was accepted last year and now the journal has moved publisher and hence style files. I do not want to have to fix this mess 😭
Jack Kennedy 🐀
boosted
Did you know that the #RoyalStatisticalSociety has awards for excellence in statistical journalism?
You don't need to be UK based to enter.
Categories this year
- Data visualisation
- Explaining the facts
- Investigative journalism (using previously unpublished statistics either through unpublished data that have been sourced and analysed by the journalist or new analyses of existing data)
- Best statistical commentary by a non-journalist
More info and entry criteria
https://rss.org.uk/training-events/events/excellence-awards/journalism-awards/
Jack Kennedy 🐀
boosted
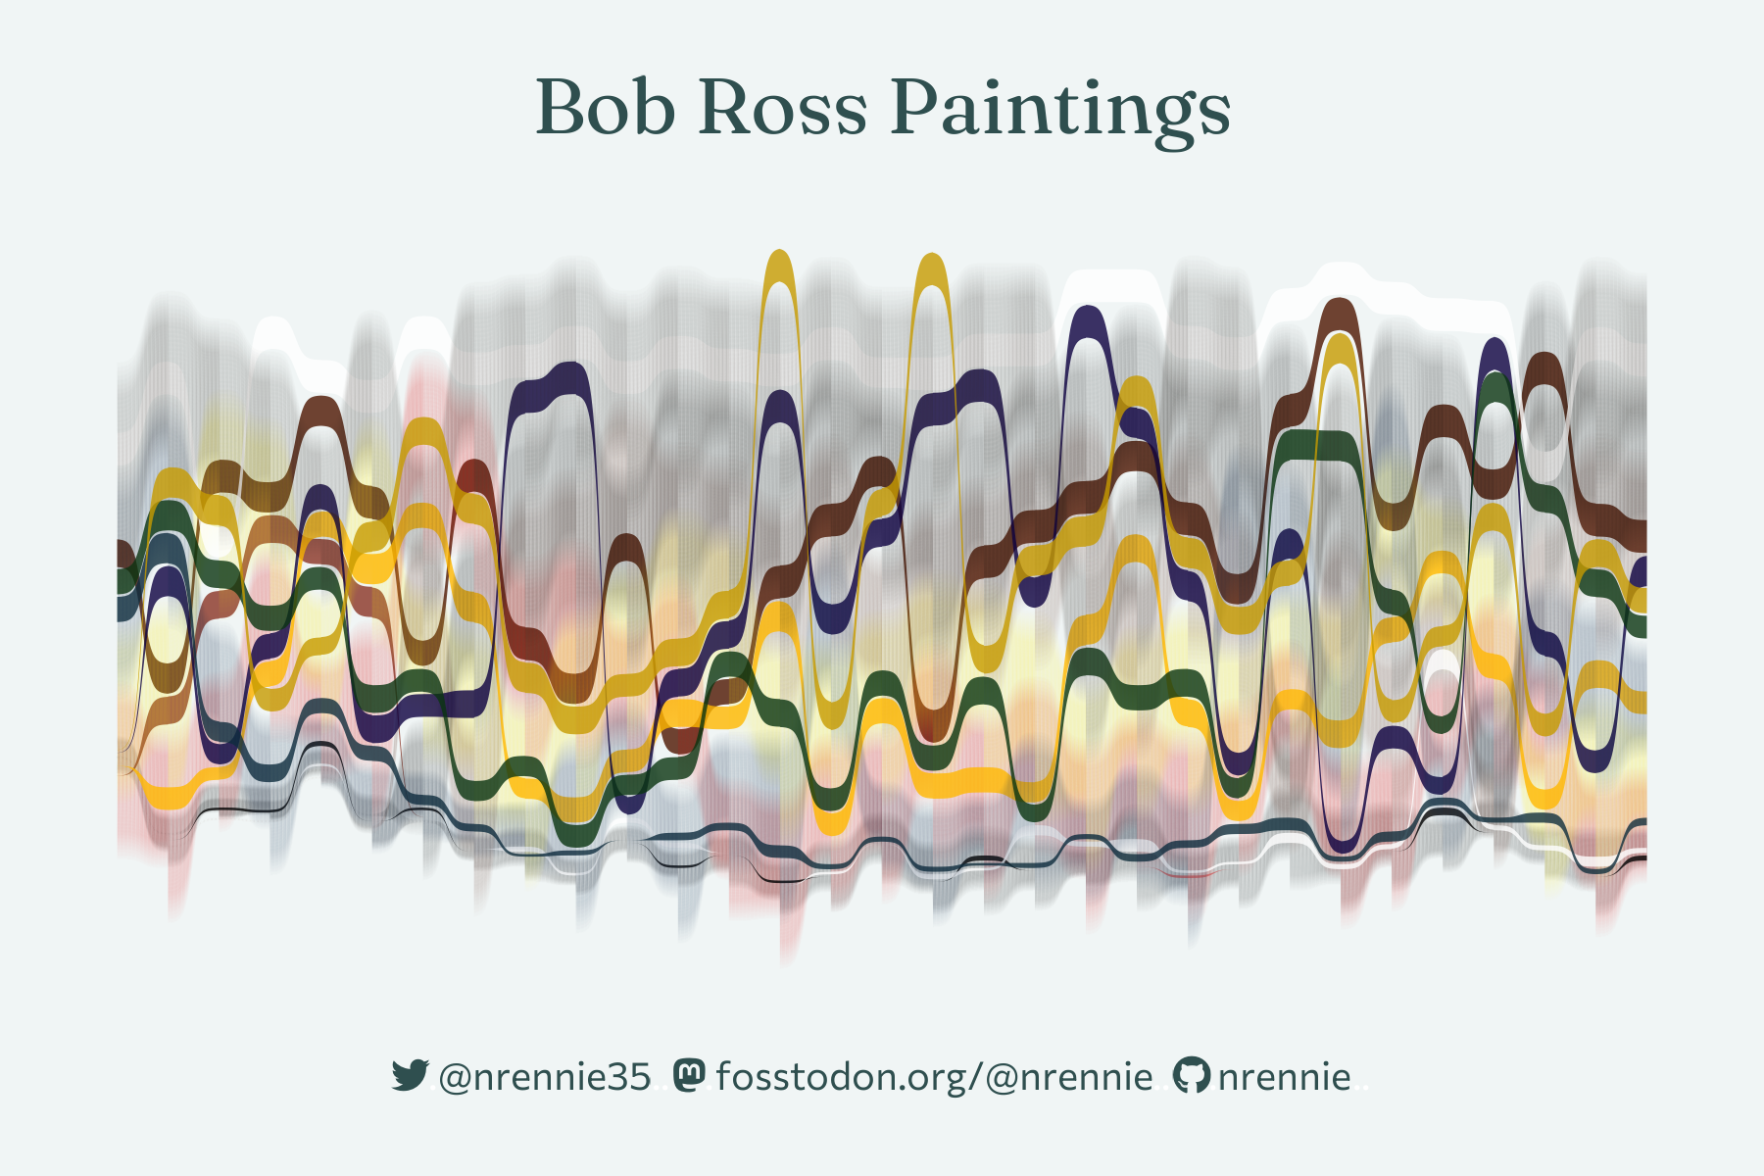
For the Bob Ross paintings data for #TidyTuesday this week, I went for a cross between data viz and generative art 🎨
I created a sankey chart to visualise the colours used across different seasons of the show! 🖼️🖼️
Code: https://github.com/nrennie/tidytuesday/tree/main/2023/2023-02-21
Jack Kennedy 🐀
boosted

Jack Kennedy 🐀
boosted

Have recently been playing around with `ggh4x`, which provides some nice drop-in extensibility for ggplot2.
E.g. Tufte-style "floating axes". (Very easy in base plot, but a bit of a pain in vanilla ggplot2.) https://teunbrand.github.io/ggh4x/reference/guide_axis_truncated.html#ref-examples
Jack Kennedy 🐀
boosted
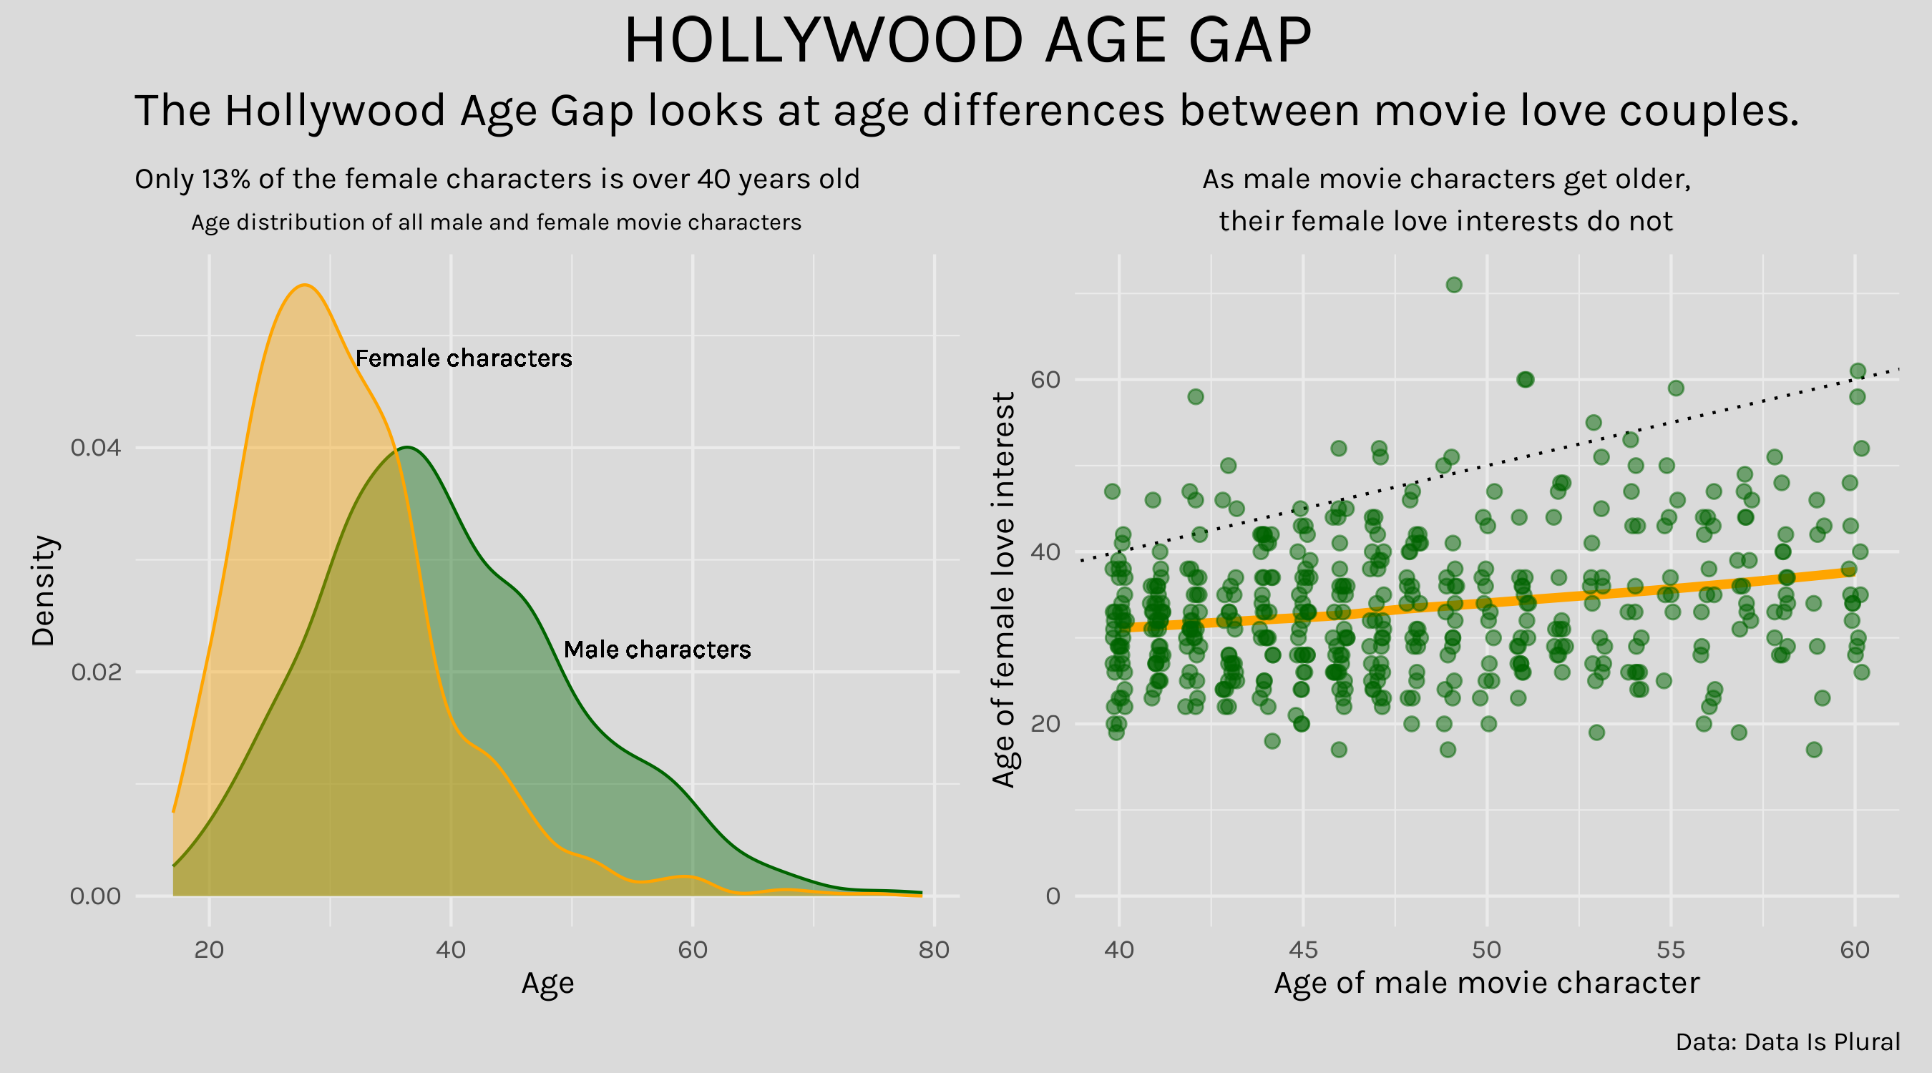
This week in #TidyTuesday we look at Hollywood Age Gaps!
can't watch netflix on train wifi but you can install #rstats packages!
all this back and forth is painfully slow (and not actually resulting in a viva date)
why can't my viva just be organised via doodle poll
Jack Kennedy 🐀
boosted

You've heard about Stan and want to learn some more? Maybe you're about to step into the Bayesian paradigm and don't know where to start 🤔
In this week's blog post, we'll take a look what you can do with #Stan and draw comparisons to #JAGS!
Jack Kennedy 🐀
boosted
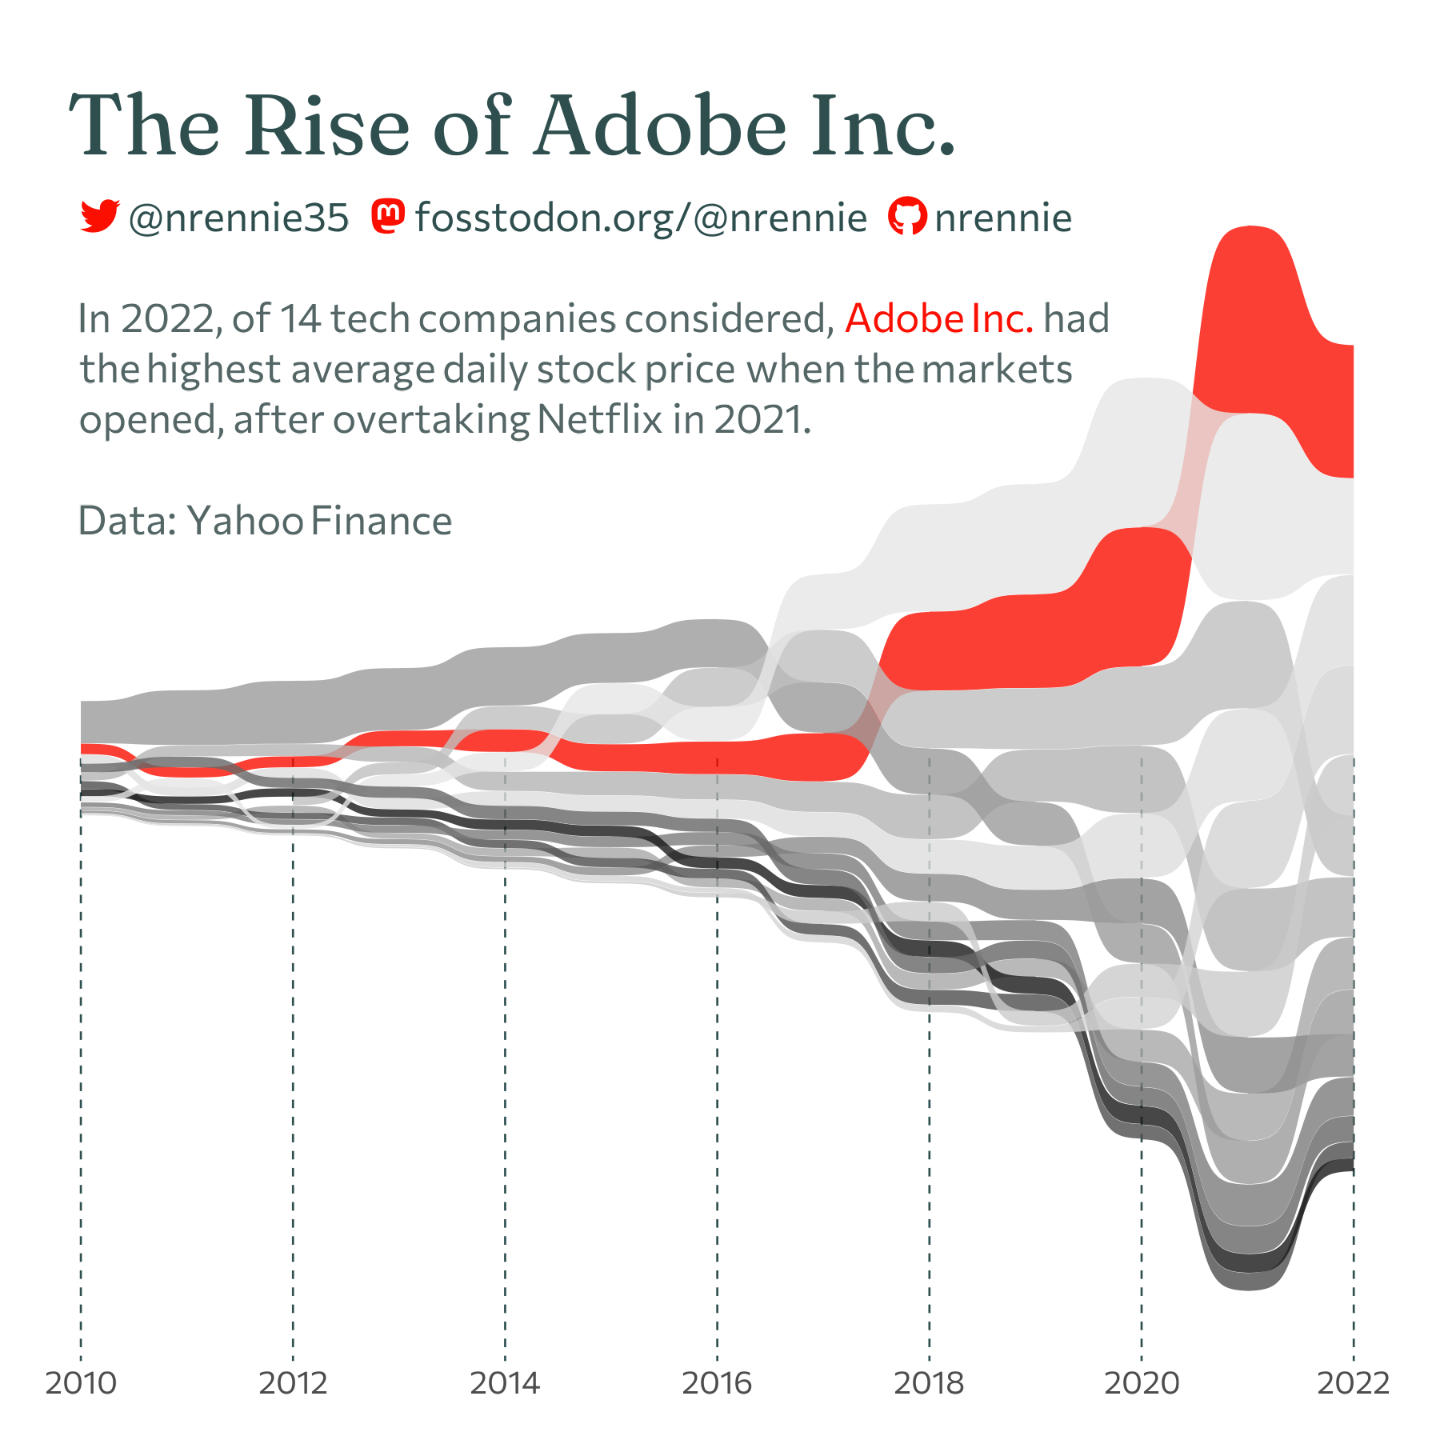
It's time for #TidyTuesday again! Thanks to Evan Gower for sharing the data this week!
We're looking at stock prices of tech companies, and I used geom_sankey_bump() from {ggsankey} to look at the rank of Adobe over time!
Code: https://github.com/nrennie/tidytuesday/tree/main/2023/2023-02-07
Big stonks for #TidyTuesday unless you're IBM! Had fun using corrr::networkwork_plot() for a really fast & effective way to identify correlations ... then spent ages colour coding the subtitle and adding the side plots
code: https://github.com/jcken95/tidytuesday/tree/main/2023/2023-02-07
Jack Kennedy 🐀
boosted

"Can you explain this gap in your resume?"
"Yes, I used LaTeX and couldn't fix that bit"
Jack Kennedy 🐀
boosted

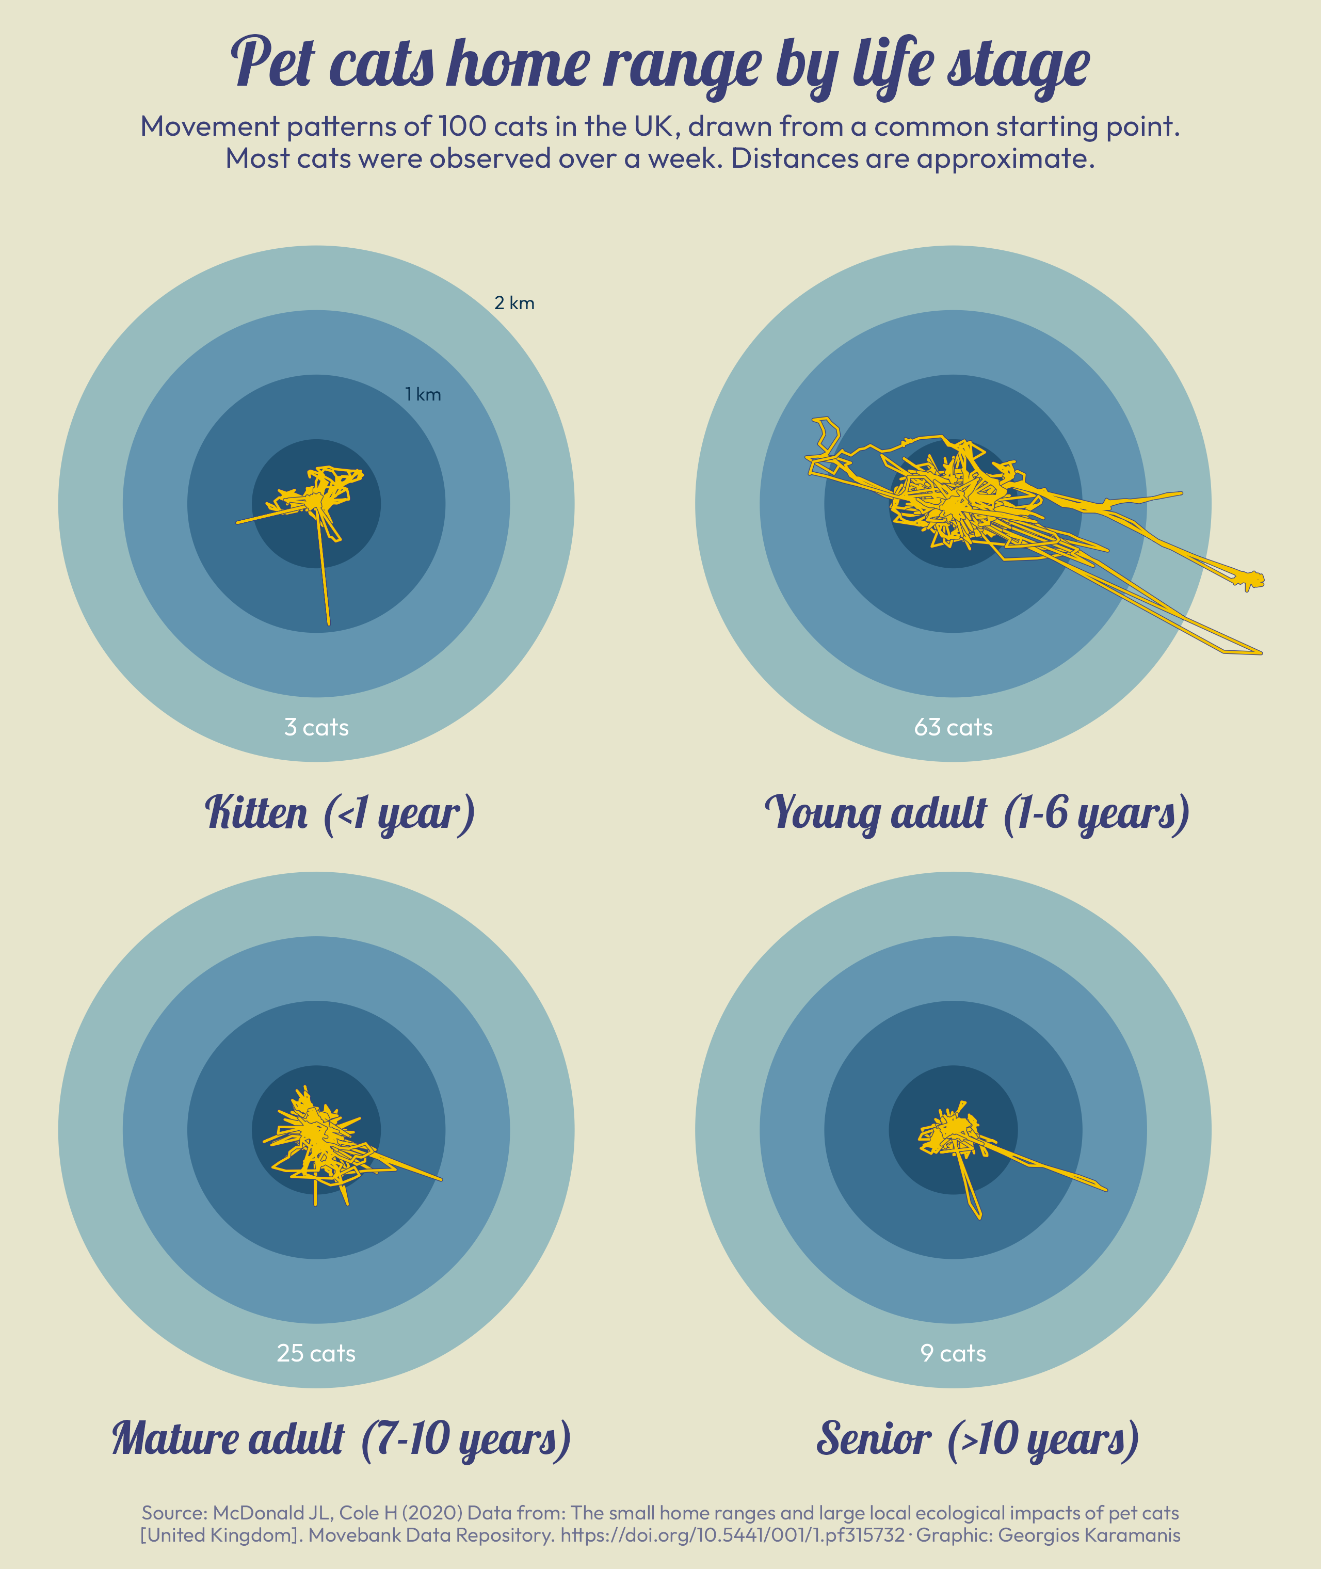
Pet cats movement range by life stage for this week's #TidyTuesday
code: https://github.com/gkaramanis/tidytuesday/tree/master/2023/2023-week_05
Jack Kennedy 🐀
boosted




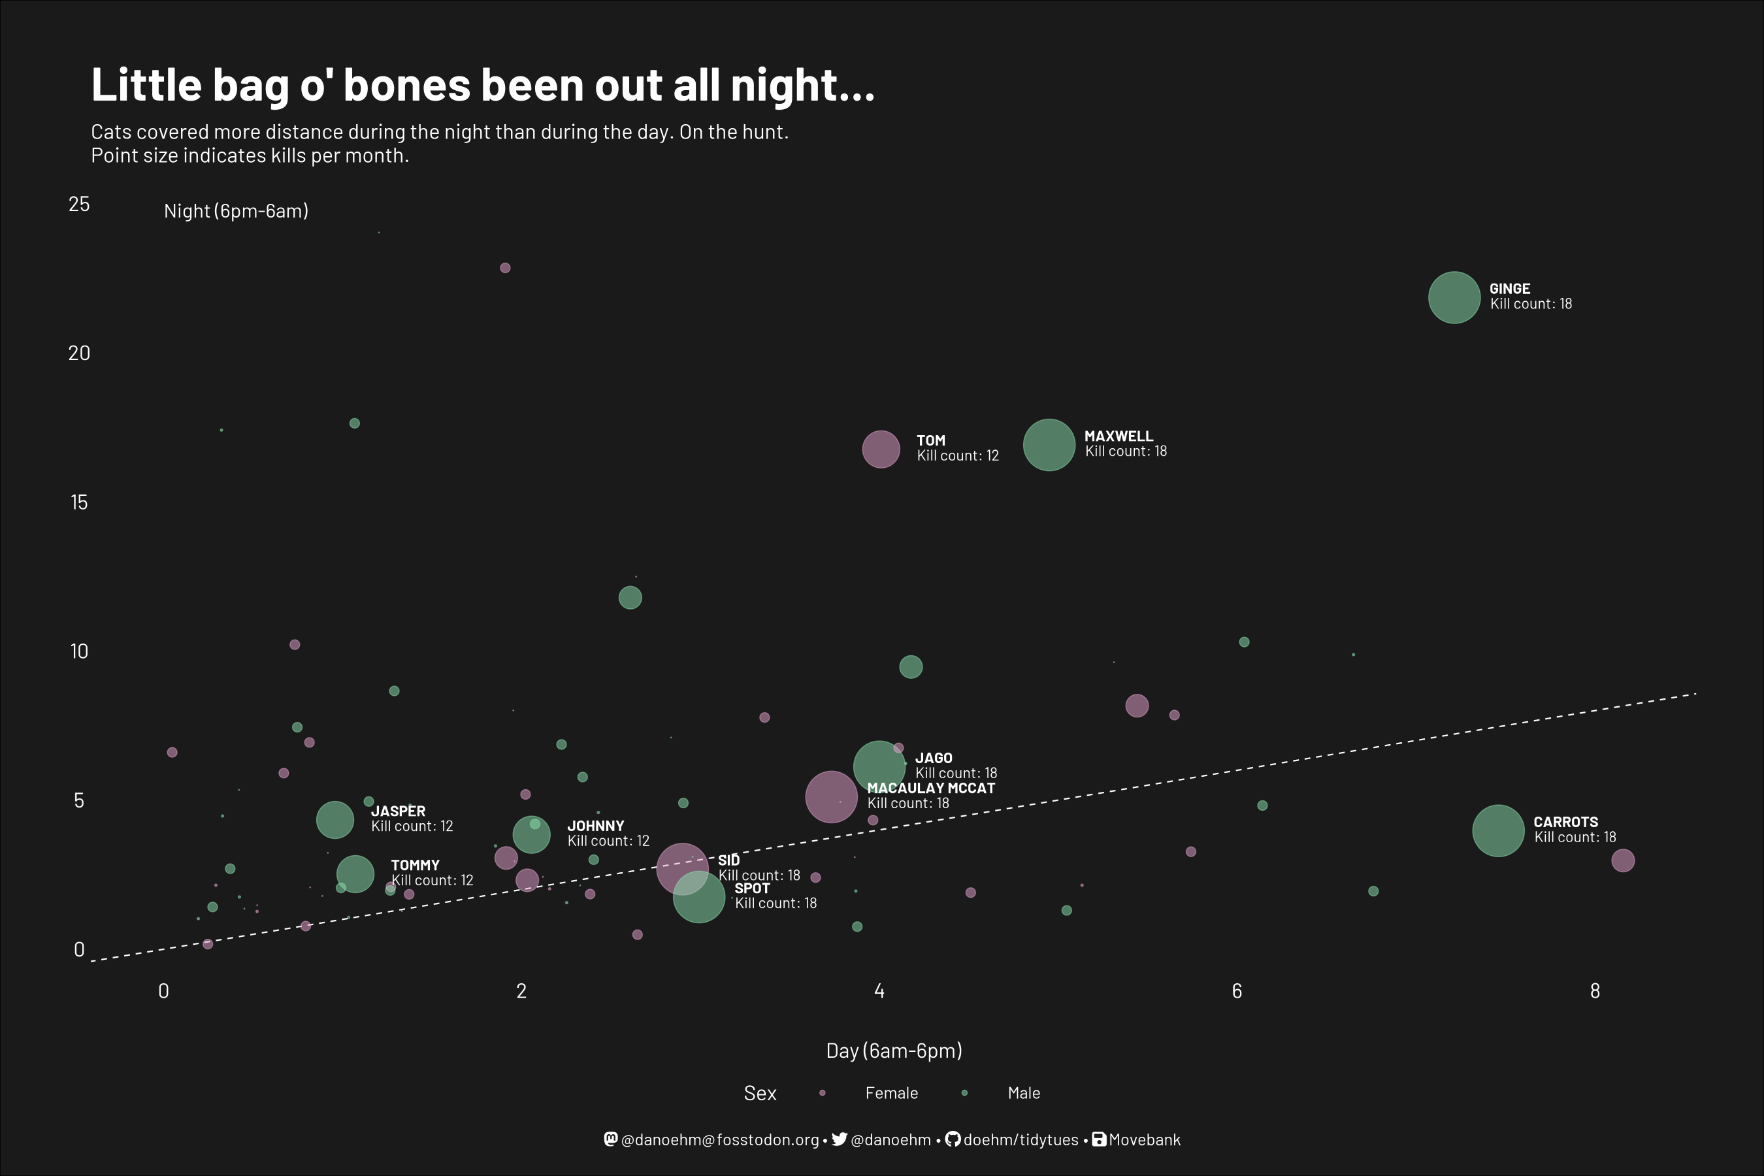
#TidyTuesday week 5: Cats in the UK 🐱
I had The Presidents in my head the whole time making this.
🔗 https://github.com/doehm/tidytues
#Rstats #dataviz #r4ds #ggplot2
just took some broken mudguards off my bike and found out in the process that the leg on my pannier rack has snapped 😭😭😭😭 #biketooter
- https://twitter.com/_jcken
I have a stats PhD from Newcastle and work as a senior data scientist at UKHSA
Royal statistical society volunteer
🌲 🐕 🚵♂️ | views own | he/him
Joined Nov 2022
