

🎓 Dr. Freemo  🇳🇱
@freemo@social.cleverlibre.org
- UFoI Member
- http://UFoI.org/u/freemo/
- Website
- http://JeffreyFreeman.me
- Gitlab
- https://git.qoto.org/freemo
Admin
Jeffrey Phillips Freeman
Innovator & Entrepreneur in Machine Learning, Evolutionary Computing & Big Data. Avid SCUBA diver, Open-source developer, HAM radio operator, astrophotographer, and anything nerdy.
Born and raised in Philadelphia, PA, USA, currently living in Utrecht, Netherlands, USA, and Thailand. Was also living in Israel, but left.
Pronouns: Sir / Mister
(Above pronouns are not intended to mock, i will respect any persons pronouns and only wish pronouns to show respect be used with me as well. These are called neopronouns, see an example of the word "frog" used as a neopronoun here: http://tinyurl.com/44hhej89 )
A proud member of the Penobscot Native American tribe, as well as a Mayflower passenger descendant. I sometimes post about my genealogical history.
My stance on various issues:
Education: Free to PhD, tax paid
Abortion: Protected, tax paid, limited time-frame
Welfare: Yes, no one should starve
UBI: No, use welfare
Racism: is real
Guns: Shall not be infringed
LGBT+/minorities: Support
Pronouns: Will respect
Trump: Moron, evil
Biden: Senile, racist
Police: ACAB
Drugs: Fully legal, no prescriptions needed
GPG/PGP Fingerprint: 8B23 64CD 2403 6DCB 7531 01D0 052D DA8E 0506 CBCE
Joined Jul 2018
🎓 Dr. Freemo 🇳🇱
boosted
🇳🇱
boosted

@DissidentKitty@sunbeam.city I dunno. Maybe ask the admin what's up with that. Oh wait, you can't because you have them blocked. 
BTW it's probably because you don't have authorized fetch enabled.
@DissidentKitty@sunbeam.city @Gargron
This has **nothing** to do with anything in our code. Our code is 100% public and we in no way circumvent your privacy settings.
What exactly is the complaint? Gargron is welcome to review our source code to see what I am saying is true.
@hansw@mastodon.social Of course, its a pleasure for me as well.
@hansw@mastodon.social Fair, certainly good to look at just in case. But of course that would be a huge coincidence, but cant hurt to check
@admin @DissidentKitty@sunbeam.city Are you seriously claiming that saying i will listen to respectful opinions as "subtly racist"? That sounds like a huge stretch but ok...
Wait what? Where did I say something that was subtle racist exactly?
@DissidentKitty@sunbeam.city
@hansw@mastodon.social That is true, the paywall is a huge issue.
@hansw@mastodon.social Yes they do, but hte change in homicide was sudden. So if there is a change in minimum wage that caused it, or similar effect, it would have to have happened shortly before the spike in homicide right?
As such can you show there was a change in minimum wage or other factor at that moment in time across all countries that would explain it?
Obviously your explanation is far less likely statistically to occur so requires evidence to support.
@hansw@mastodon.social No argument there, this is hardle scientiffic standard of peer review, no doubt. But im hardly the first person tobe making this claim. There are countless studies already done in the USA that covers what I'm saying.
@hansw@mastodon.social yes it does, i didnt say it doesnt have an effect. The effect simply wouldnt happen all at once. Quality of life changes gradually not overnight. So you wouldnt see a peak but a gradual rise.
Moreover youd have to show that the quality of life changed abruptly at the exact same time as the law in guns changed in every single country observed...
Sounds like an awfully big coincidence your assuming, do you have any evidence to back up the idea that quality of life changed at the same time as gun laws in all cases?
@admin @DissidentKitty@sunbeam.city
Oh yea and we explicitly state we ban for racism... so explicitly stating racism isnt tolerated I'd say trumps any possible ambiguous dog whistle that may or may not exist.
One could also say it is a protection for LGBT members, a reassurance that just because their views may be unpopular with someone we will still protect them.
Moreover I'd ask them if they can point to even a single user of ourse who have ever expressed hate based racism or nazi ideology to any degree... I'd also point them to the fact that we have LGBT members as moderators.
@DissidentKitty@sunbeam.city
@hansw@mastodon.social The point of the granger causality is specifically so we dont need to actually compare those other qualities. The fact that we consistently see a spike after gun laws are enacted tells us it is due to the gunlaws. The only way it wouldnt be is if in every single country we looked at there was an abrupt change in quality of living at the exact same moment the gun laws were enacted, which isnt the case. So if the spike were caused by these sorts of factors it would either be more gradual or wouldnt directly preceed the gun law event but instead would directly precede a different event, whatever event caused a change in quality of life.
@hansw@mastodon.social I could probably get some data for you on ireland's population growth at the time frame graphed. Shouldn't be too hard.
@hansw@mastodon.social Here is a higher resolution version of the ireland graph.
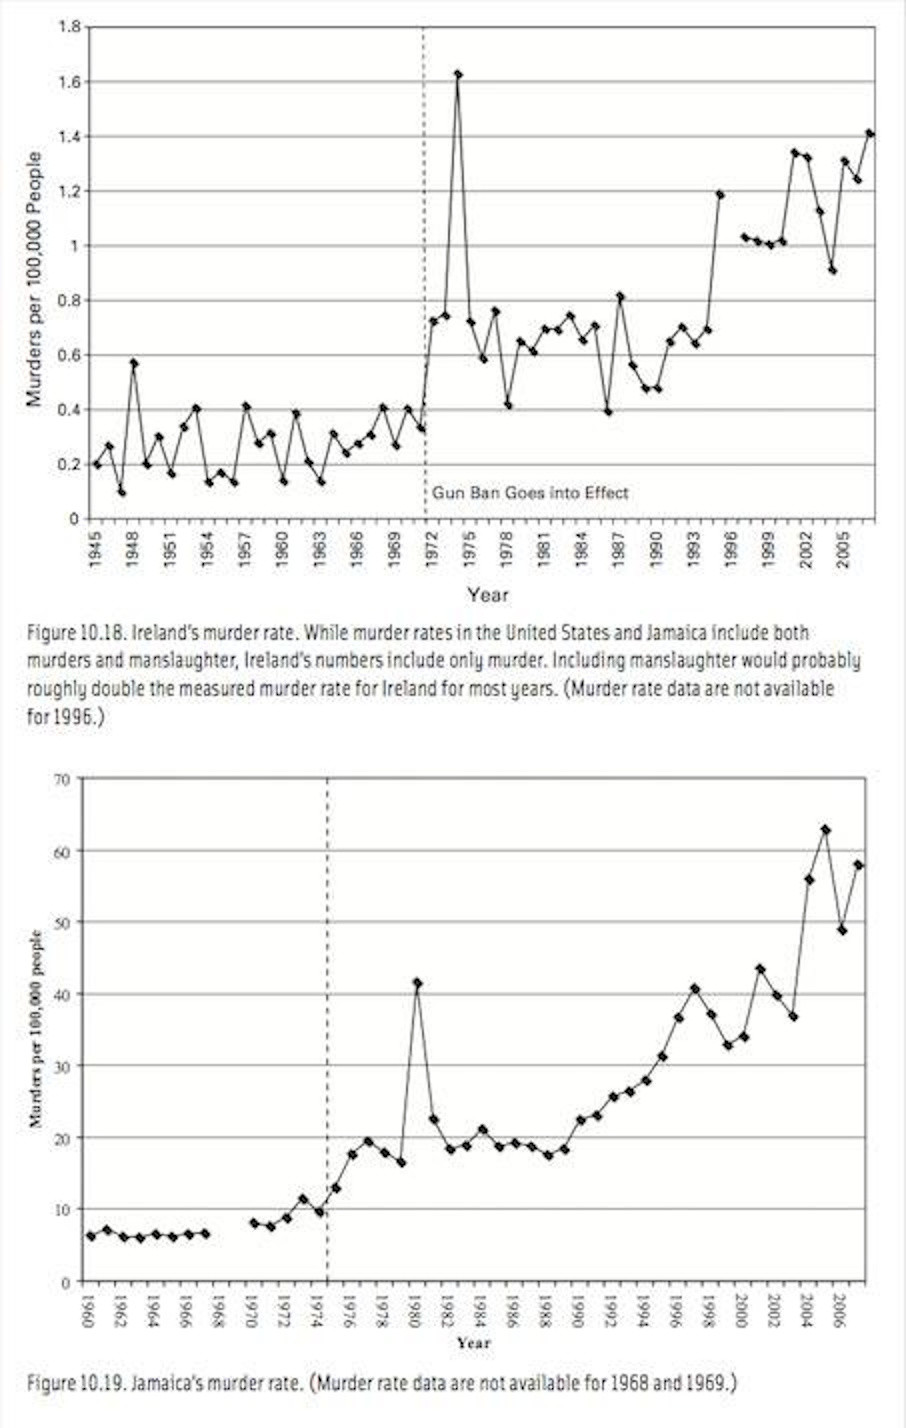
@hansw@mastodon.social I can provide a hier resolution version of the ireland one for you, give me a minute.
@hansw@mastodon.social Very good of you to point out population growth, indeed that is important. You will notice none of the graphs I provided have raw numbers on the y axis. These graphs are already normalized for population growth. That is, the y axis are rates (in one case percentage in the other it is per 100,000). That ensures all these graphs already account for population growth in how they are drawn.
@hansw@mastodon.social I am at a bit of an advantage, being a professional data scientist and having spent a lot of time researching the issue of guns. So thankfully I have a lot of the data we need already, though I do encourage you to double check my data from the sources I cite and of course feel free to compile data from other sources too.
@hansw@mastodon.social Great I think that will giveus a foundation to work with.
So Now ill provide some data, let me explain a bit how the granger causality test works so we can understand what would be considered valid data.
Generally causality tests are how we determine data shows causality rather than correlation. To do this the dependent variable is observed following some change. Since one event preceeds the other, presuming this happens consistently across many populations, then we can be confident that there is causality between them.
So for example we will look at how the homicide or violent rates of a population are effected in the decade or two immediately following changes in laws with guns. The question we need to answer is if making guns illegal, or restricted, causes homicide and violence (of any type) to go up , down, or maybe has no effect on it at all. We can look at both cases where guns are made illegal/restricted, as well as cases where gun laws are relaxed and see if there is a consistent pattern.
This way we can test to see if guns do in fact prevent violent crimes, or if they cause them, it will also address arguments where other forms of violence, like knife violence may have otherwise been prevented, or perhaps caused by the lack of guns. So it covers all the arguments at once.
Attached are several graphs of this nature. I can provide dozens more of this same nature from many more countries if you'd like. I am limited to only 4 images per post so ill post 4 such graphs here.


mh---
@mngrif Sounds like you need to go back to bed
- UFoI Member
- http://UFoI.org/u/freemo/
- Website
- http://JeffreyFreeman.me
- Gitlab
- https://git.qoto.org/freemo
Admin
Jeffrey Phillips Freeman
Innovator & Entrepreneur in Machine Learning, Evolutionary Computing & Big Data. Avid SCUBA diver, Open-source developer, HAM radio operator, astrophotographer, and anything nerdy.
Born and raised in Philadelphia, PA, USA, currently living in Utrecht, Netherlands, USA, and Thailand. Was also living in Israel, but left.
Pronouns: Sir / Mister
(Above pronouns are not intended to mock, i will respect any persons pronouns and only wish pronouns to show respect be used with me as well. These are called neopronouns, see an example of the word "frog" used as a neopronoun here: http://tinyurl.com/44hhej89 )
A proud member of the Penobscot Native American tribe, as well as a Mayflower passenger descendant. I sometimes post about my genealogical history.
My stance on various issues:
Education: Free to PhD, tax paid
Abortion: Protected, tax paid, limited time-frame
Welfare: Yes, no one should starve
UBI: No, use welfare
Racism: is real
Guns: Shall not be infringed
LGBT+/minorities: Support
Pronouns: Will respect
Trump: Moron, evil
Biden: Senile, racist
Police: ACAB
Drugs: Fully legal, no prescriptions needed
GPG/PGP Fingerprint: 8B23 64CD 2403 6DCB 7531 01D0 052D DA8E 0506 CBCE
Joined Jul 2018
