Going through deleting my posts on the bird site...and came across this fun one:
"So many different use cases for data viz!
When I start a project, I usually do standard charts first...so that I can explore patterns in the data
But often, I work on viz is isn't about patterns, but revealing chaos and possible solutions to reducing chaos
Like this one"
#dataviz #maps #art


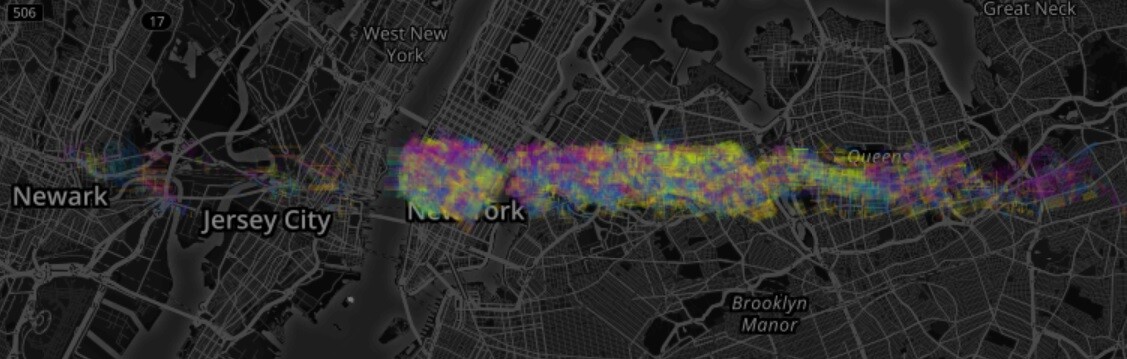

@2ck it's the positions of a certain type of vehicle, over a period of time.