RT @ghoeberx
NEW #COVID19 CHART
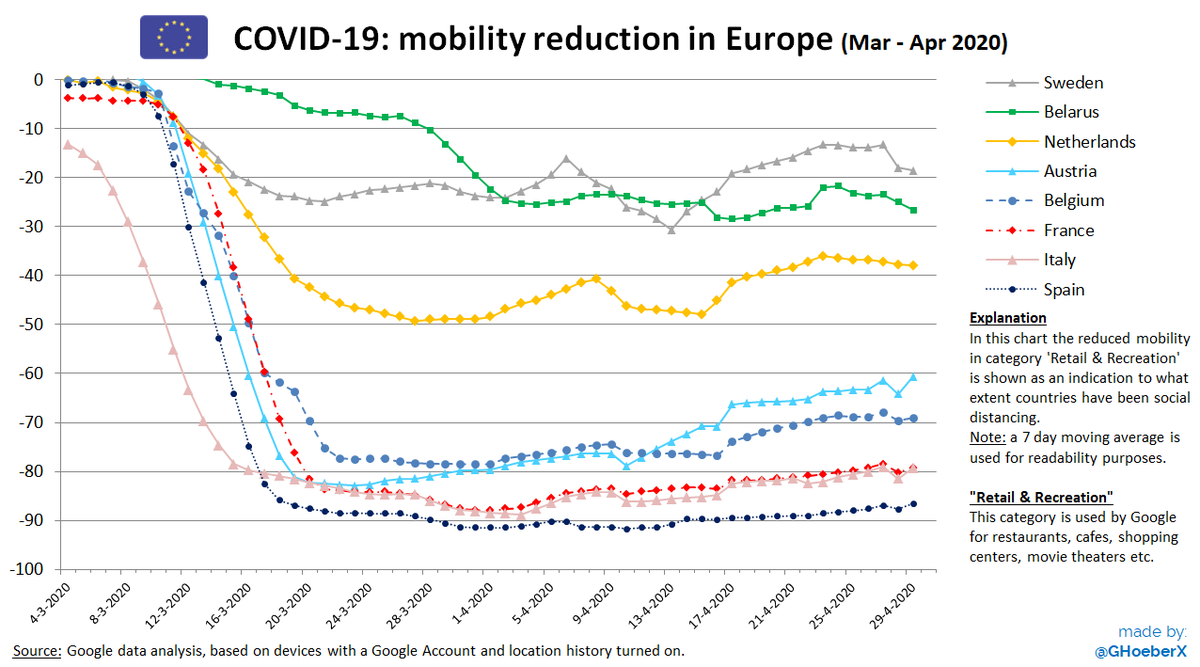
🇪🇺 Europe, mobility reduction (Mar - Apr 2020)
📊In below chart I compare the mobility reduction in 8 different European countries.
A line going close to the bottom of the chart (=closer to -100%) means more people have NOT been visiting restaurants, bars etc