
The long-run perspective on global poverty.
The chart shows that poverty declined relative to various poverty lines – most rapidly in the two decades up to the COVID pandemic.
This chart is from our page on poverty where we also discuss how the pandemic impacted global poverty: https://ourworldindata.org/poverty

Follow

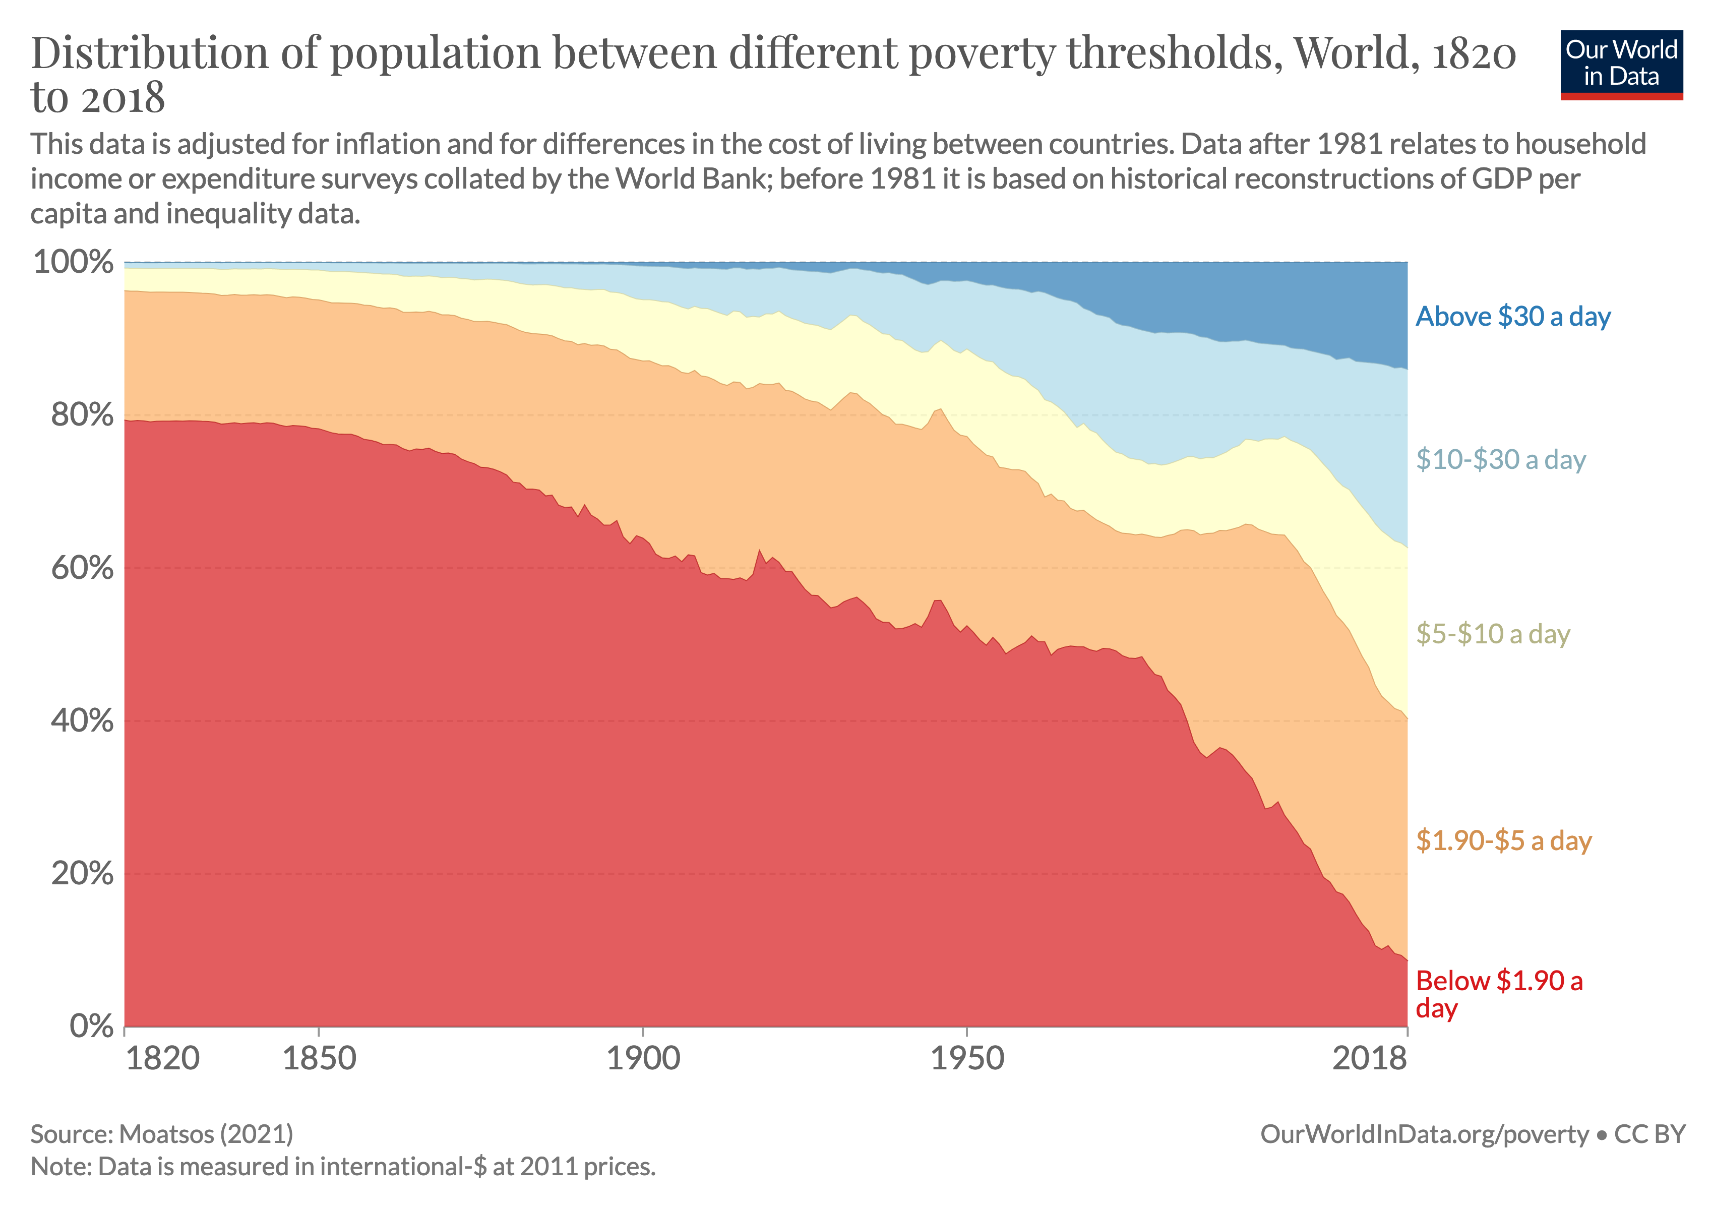
Here's the same plot in absolute numbers: https://ourworldindata.org/grapher/distribution-of-population-between-different-poverty-thresholds-historical?stackMode=absolute&country=~OWID_WRL
Draw your own conclusions.


@FailForward @maxroser Thank you! It's 674 millions (2018) vs 794 millions (1820).