

Jack Kennedy 🐀 @_jcken@social.cleverlibre.org
- https://twitter.com/_jcken
I have a stats PhD from Newcastle and work as a senior data scientist at UKHSA
Royal statistical society volunteer
🌲 🐕 🚵♂️ | views own | he/him
Joined Nov 2022
Frustrating one for #TidyTuesday - struggled to get good spacing for the flags without mucking up the aspect ratio on the image of Bobby Moore.
Preserving aspect ratios for {ggimage} seems basically impossible. Trying to get good horizontal spacing warps the aspect ratio. Maybe with more time I could get it to work?
And although we beat (West) Germany in 1966, they've definitely punished us for it over the years ...
Code: https://github.com/jcken95/tidytuesday/tree/main/2022/2022-11-29
also, what should I be looking for in a camera? ride in basically all weather and light conditions, apart from ice
#biketooter - any recommendations for an actioncam? Ever since _that_ bbc documentary aired about a month ago, close passes/aggressive behaviour towards me as a cyclist seems to be much more frequent and increasing risky

Trying to finalise my thesis but my external keeps publishing _more_ papers 😫
Jack Kennedy 🐀
boosted

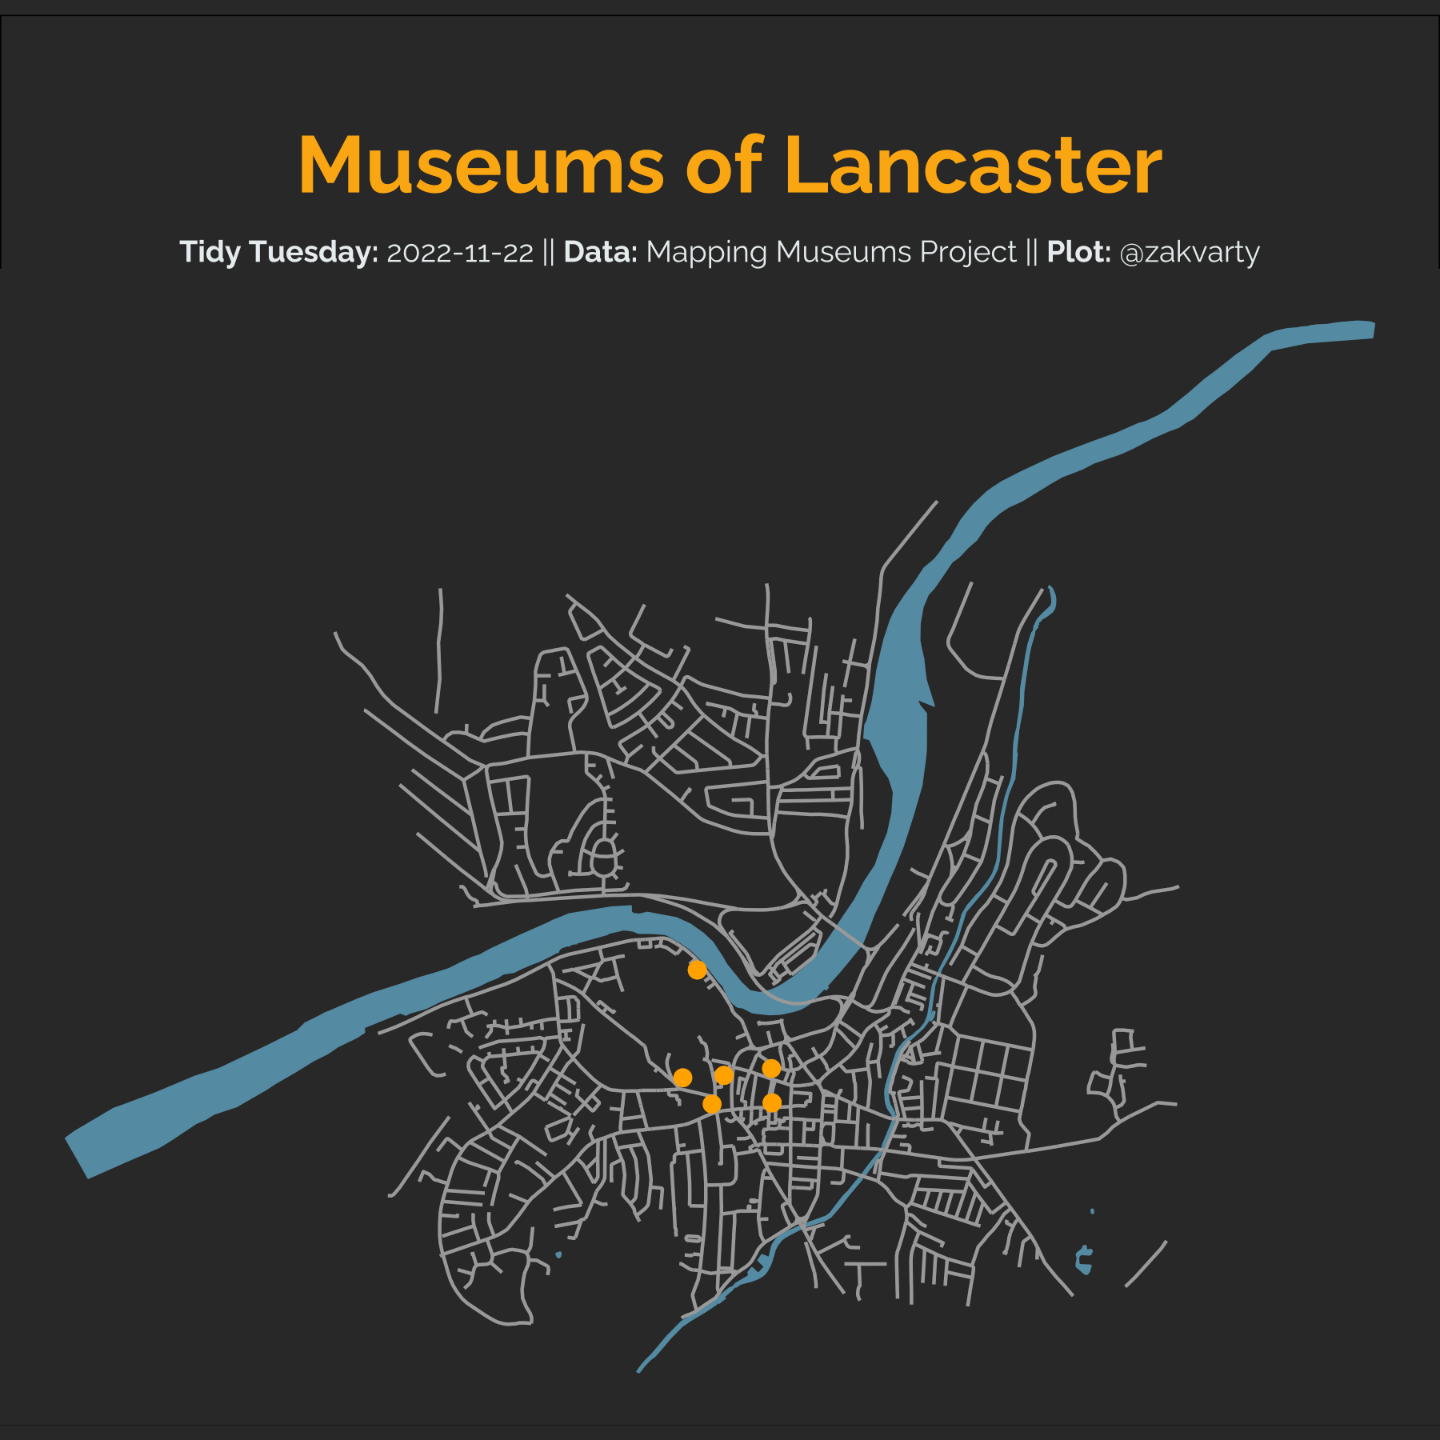
Wrapped up my weekend by doing #TidyTuesday.
The data was on UK museum locations 🏛️ This meant facing my #RStats nemesis - maps!
I mapped the museums of Lancaster and found some I never knew about in the process. Can you spot the maratime museum?
Code: https://github.com/zakvarty/tidy-tuesday/tree/main/2022/2022-11-22
Jack Kennedy 🐀
boosted

I know only a little about the eigendecomposition of symmetric matrices
So while I’m not always *positive* about my knowledge, I am *semi* definite
Jack Kennedy 🐀
boosted

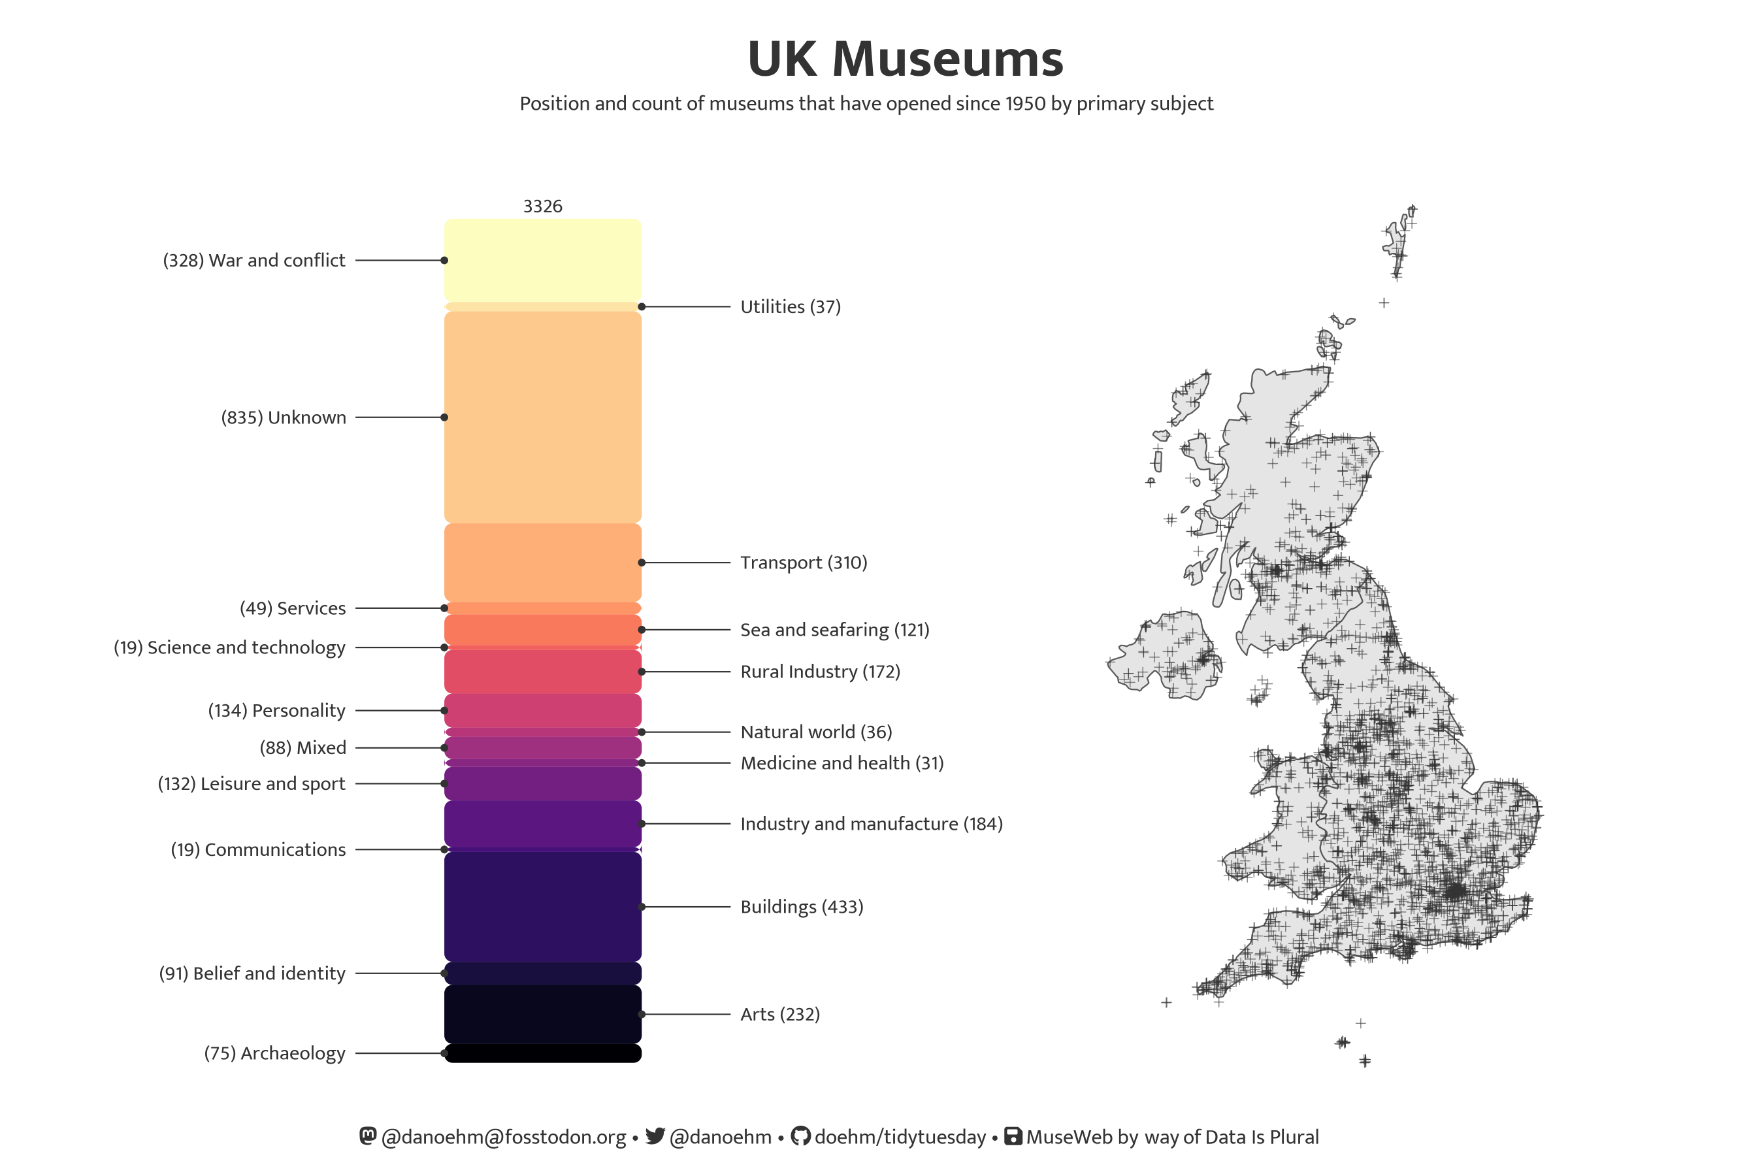
#TidyTuesday week 47: UK Museums 💂
Position and count of museums that have opened since 1950 by primary subject
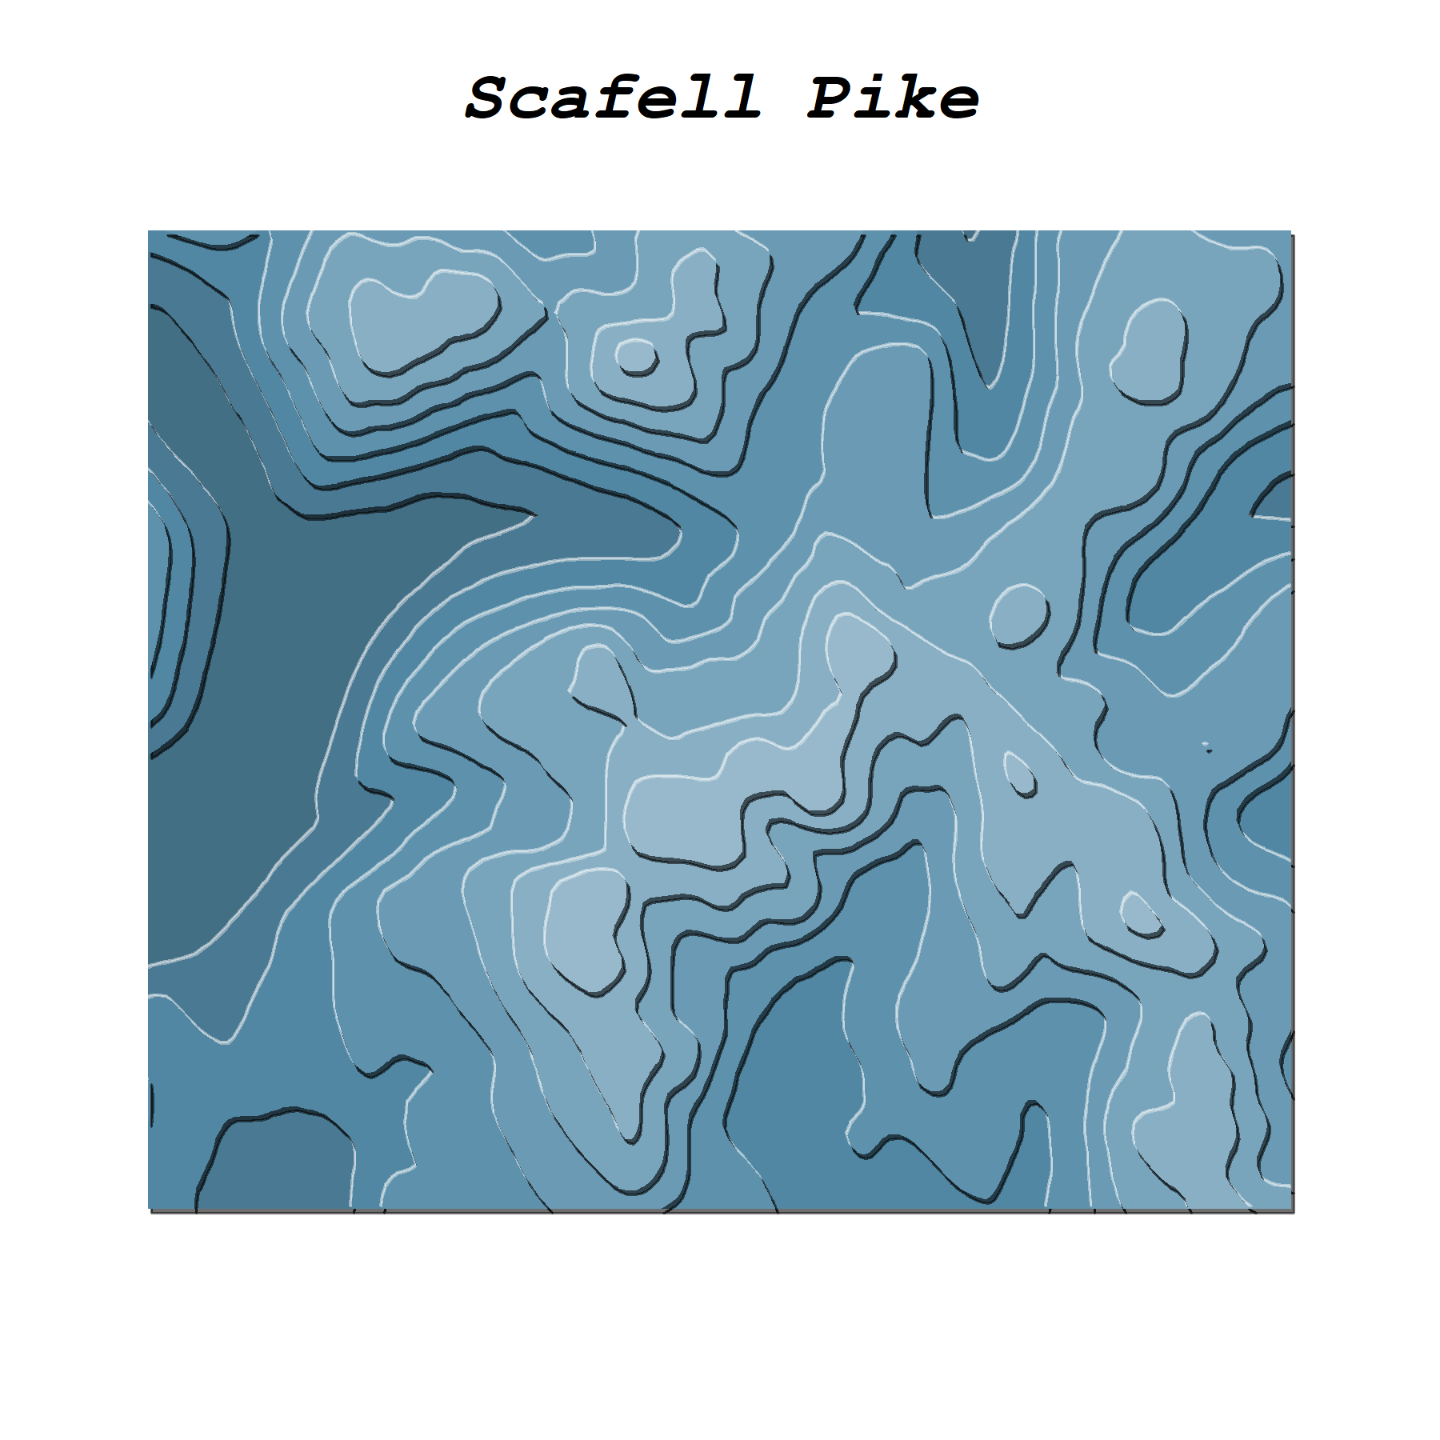
the pencil museum isn't the only indoor attraction in the lake district! This week's #TidyTuesday looks at museums in the UK, decided I'd look close to home for this one. Had a bit of fun learning how to use {osmdata} drawing maps
code: https://github.com/jcken95/tidytuesday/tree/main/2022/2022-11-22
Jack Kennedy 🐀
boosted

A recent article in Nature discussed how researchers are using large language models as research assistants. But is this a good idea? We spoke with our editorial board member Detlef Nauck about #llms and the risk of #bias, #plagiarism and model 'hallucintations' (#ai #machinelearning #datascience) https://realworlddatascience.net/news-and-views/editors-blog/posts/2022-11-23-LLMs-content-warning/LLM-content-warning.html
Jack Kennedy 🐀
boosted

A simple plot for this week's #TidyTuesday hiding lots of messy data wrangling in the background! I calculated the change in estimated number of open museums in areas with different levels of deprivation 🏛️🏛️🏛️
Code: https://github.com/nrennie/tidytuesday/tree/main/2022/2022-11-22
#RStats #R4DS #DataViz #DataVisualisation #DataVizualisation
Jack Kennedy 🐀
boosted

Jack Kennedy 🐀
boosted

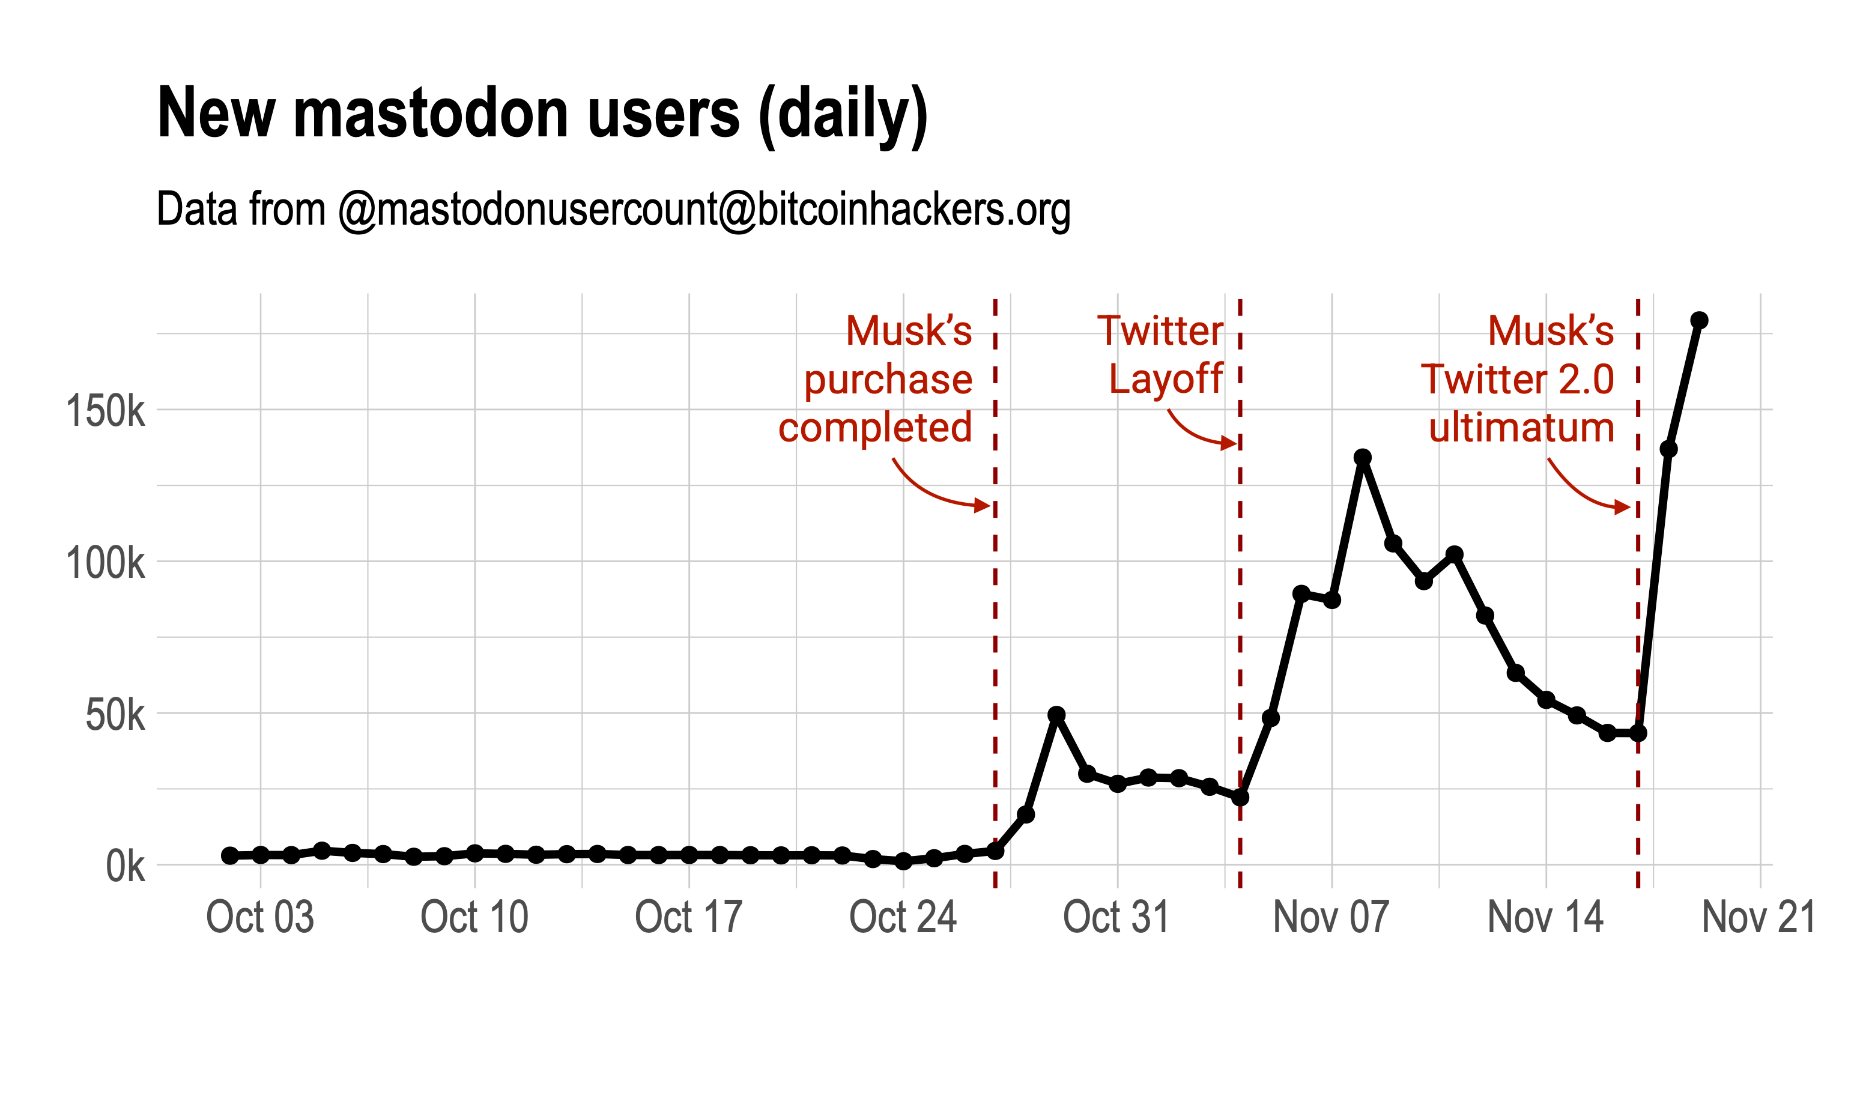
Almost 180k new users joined #mastodon yesterday, a new record. This third #twitterMigration wave happened after Musk's Twitter 2.0 ultimatum to #Twitter workers. Each wave is stronger than the previous one. Here is my updated plot showing the three consecutive waves.
Jack Kennedy 🐀
boosted
I tried out the {tanaka} #rstats package for the first time today for the "blue" prompt on #Day18 of the #30DayMapChallenge!
Code: https://github.com/nrennie/30DayMapChallenge/blob/main/2022/scripts/18_blue.R
Since this week's #TidyTuesday is about accessibility on the web, I decided to investigate options for making graphics more accessible
{ColourblindR} takes away the problem of choosing a CVD friendly palette by automatically generating a CVD friendly palette
Code: https://github.com/jcken95/tidytuesday/tree/main/2022/2022-11-15
Blog post about {ColourblindR}: https://ubc-mds.github.io/ColourblindR/
Jack Kennedy 🐀
boosted
A thread about this week’s #TidyTuesday data on page metrics: recreating graphics using #RStats and detecting changes in time series data! To start off with, for this week’s data about page metrics, I recreated the graphic in this article [https://blog.datawrapper.de/why-web-pages-can-have-a-size-problem/](https://blog.datawrapper.de/why-web-pages-can-have-a-size-problem/) 🧵
#DataViz #R4DS #DataVisualisation #DataVizualisation #Statistics
Jack Kennedy 🐀
boosted
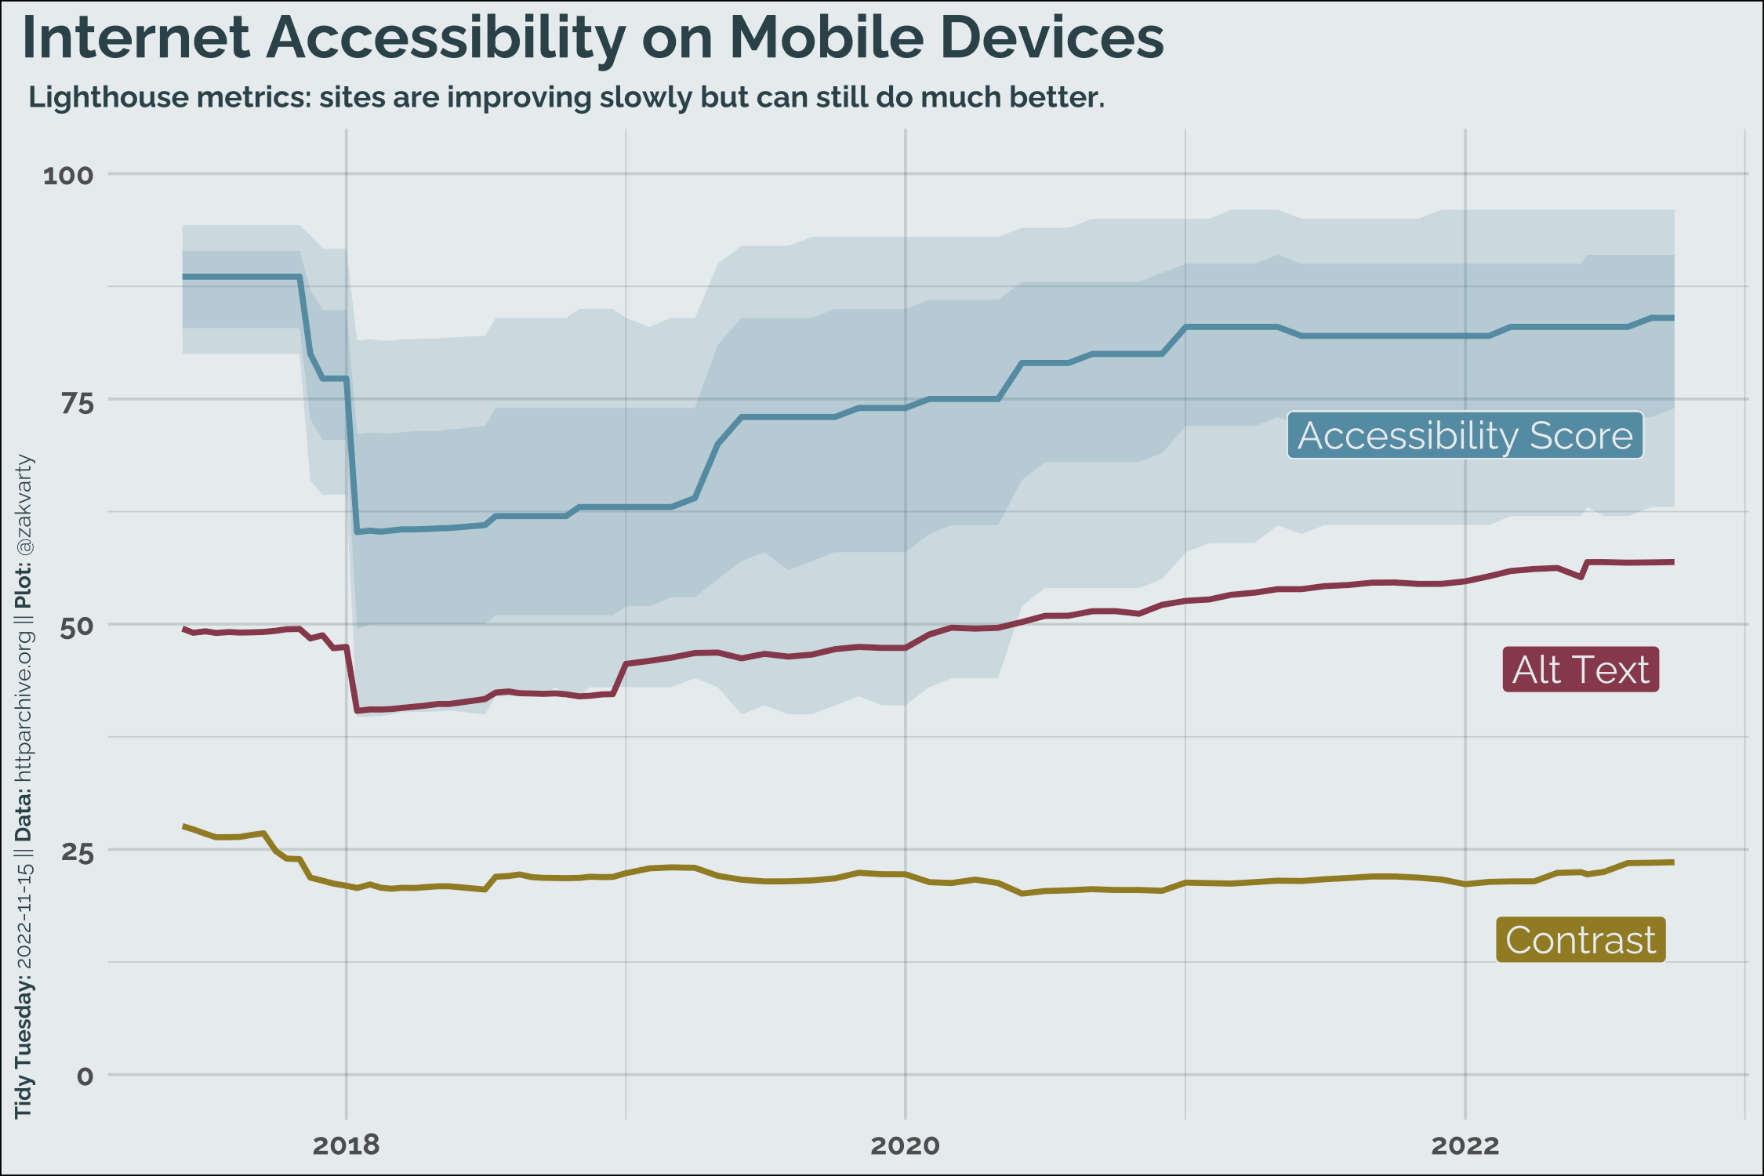
Today's #TidyTuesday is an #rstats exploration of internet accessibility.
Websites are slowly improving their accessibility and use of alt-text. However, we can still do much better - particularly by ensuring that pages have colour schemes with sufficiently high contrast. ⌨️🎨
Code and further exploration of the metrics used: https://github.com/zakvarty/tidy-tuesday/tree/main/2022/2022-11-15
Jack Kennedy 🐀
boosted
Hello people of Mastodon & Fosstodon! Nice to be here with you.
We are a new project from the Royal Statistical Society - a #datascience content platform where students, practitioners, leaders & educators can share, learn about and be inspired by real-world uses of data science.
Our website is built on #Quarto. You can find us at https://realworlddatascience.net/ and on GitHub: https://github.com/realworlddatascience
#r4ds #rstats #dataviz #openscience #python #machinelearning #statistics #opensource
Jack Kennedy 🐀
boosted

long post on accessibility advice from a blind screen reader user
OK #Mastodon. I've seen several toots on #accessibility for #screenreader users, however, I've not seen one from a screenreader user (as far as I know). I've used ZoomText, Outspoken, JAWS (AKA JFW), Supernova, NVDA (Windows), and VoiceOver (both on Macs and iPhone). I don't have experience with Windows Narrator or TalkBack. I would like to rectify and clarify a few small things.
First off, any awareness of accessibility issues, and endeavours to make things more accessible is great. Keep going!
But…
Blind/low-vision people have been using the internet as long as everyone else. We had to become used to the way people share things, and find workarounds or tell developers what we needed; this latter one has been the main drive to get us here and now. Over the past decade, screen readers have improved dramatically, including more tools, languages, and customisability. However, the basics were already firmly in place around 2000. Sadly, screen readers cost a lot of money at that time. Now, many are free; truly the biggest triumph for accessibility IMHO.
So, what you can do to help screen readers help their users is three simple things.
1. Write well: use punctuation, and avoid things like random capitalisation or * halfway through words.
2. Image description: screen readers with image recognition built-in will only provide a very short description, like: a plant, a painting, a person wearing a hat, etc. It can also deal with text included in the image, as long as the text isn't too creatively presented. So, by all means, go absolutely nuts with detail.
3. Hashtags: this is the most commonly boosted topic I've seen here, so #ThisIsWhatAnAccessibleHashtagLooksLike. The capitalisation ensures it's read correctly, and for some long hashtags without caps, I've known screen readers to give up and just start spelling the whole damn thing out, which is slow and painful.
That's really all. Thanks for reading! 😘
Jack Kennedy 🐀
boosted







I'm a PhD student studying social #epidemiology, #LGBTQ health, #mentalhealth, eating disorders, and accessibility/utilization of mental health services.
Especially interested in #causalinference, system dynamics modeling, and developing/adapting quantitative methods to better model #intersectionality in health disparities research.
I spend most days beep booping with #rstats 💻, learning #bayesian methods 👻, and (unsuccessfully) preventing my cat from destroying my furniture😼
- https://twitter.com/_jcken
I have a stats PhD from Newcastle and work as a senior data scientist at UKHSA
Royal statistical society volunteer
🌲 🐕 🚵♂️ | views own | he/him
Joined Nov 2022
