
"""
Since the closure of the two reactors at Ignalina in 2004 and 2009, Lithuania switched from being an electricity exporter to importer, and significantly increased its consumption of natural gas and biomass. In 2020 some 70% of the country’s electricity requirements were met through imports.
"""
https://www.world-nuclear.org/information-library/country-profiles/countries-g-n/lithuania.aspx
Still in 2022 Lithuania had a net import of 8.7 TWh of electricity, mostly from Sweden and Latvia.

@jackofalltrades Uhm, where in this graph do fossils increase after shutdown of nuclear? I guess this comes from where the imported electricity is sourced, but tbh that's the mostest wrongestest graph to support that claim.
That's fair, this part is not clearly visible on this graph.
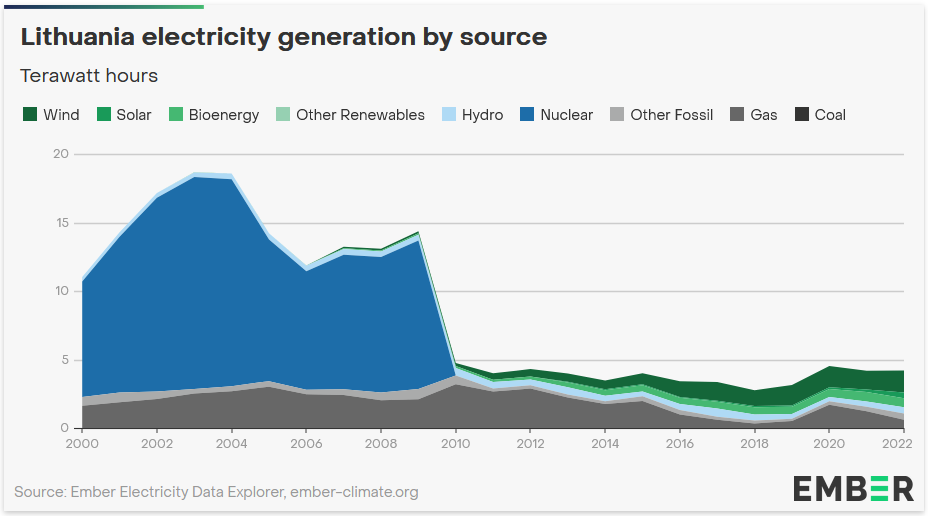
Here's a more clear picture, with the electricity split by source.
Between 2009 and 2010, when the last nuclear reactor was closed, natural gas use jumped 50% from 2.1 TWh to 3.19 TWh.
Also notice the steady growth of bioenergy, which in this case means burning wood.
"""
About 75% of heat (district and residential) is produced from burning woody biomass, after a major shift away from the use of natural gas.
"""

As a side note, the growth of wind and solar looks impressive until you align the Y axes (laughing through tears).

Overall, the carbon intensity of electricity produced in Lithuania hasn't yet recovered from the time when they had the nuclear reactors running.

@jackofalltrades That was to be expected (despite the quite controversial CO2eq values some publications attribute to nuclear electricity - it is certainly non-zero, contrary to what some claim).
From the last graph, at least, there is quite some progress visible. However, it does not show the import contribution. So, it may well show the progress of the providing neighbours. ;-)
@Lats

@jackofalltrades But, wow, 12 for nuclear vs. 11 for wind *is* questionable. Because the emission depends a lot on where you source your Uranium. I found these values to be questionable, especially because they seem to be particularly low in sources that favour nuclear. ;-)
@Lats
@jackofalltrades I wouldn't say *I* researched this, but it's an ongoing debate how to exactly quantify CO2eq for nuclear fuel. And the criticism is that the nuclear-friendly camp tends to take high-yield mines' CO2eq and apply it across the board, where many of the mines don't even give estimates on how much energy they spend refining the ore, let alone in-transparency on what energy is spent on enrichment.
I recently read about the Italian government's plan (popping up again and again) to use domestic Uranium sources and go all nuclear independent. Then the report looked at the quality of the domestic sources and found they are extremely low in U content, so CO2eq would be ridiculously high. And so they found both the reason why nobody is using the ore and why the programme had already died several times in the past.
@Lats
I was not aware that there is a debate about this, thank you. I will keep an eye out, but if you have any links handy I'd appreciate you sharing them. Would definitely make it easier when I decide to jump into that particular rabbit hole.
Degrading ore quality is a problem across the board, not just for uranium, but for everything we need for energy transition (or even just maintaining our current infrastructure).

@cweickhmann
Is it questionable in the "I researched this and can point you towards more reliable numbers" sense or in the "I don't like the result they got because of ideological reasons" sense?
@Lats