> The study concluded that the cities [with a minimum wage above 10 USD] had stronger private sector growth than the average comparable county. It also found that raising the minimum wage by 10% increased earnings among food services workers by 1.3% to 2.5%. And, significantly, the study found that the increase in the minimum wage in these cities did not lead to job loss.
> "We cannot detect significant negative employment effects," the study concluded.
/via nu.federati.net/notice/3355922 @lnxw48a1
Reductio ad absurdum we can plainly realize that a minimum wage of 1 MUSD will drive inflation and/or cause unemployment, but this is just the latest of a number of recurring studies showing that raising the real bottom-of-the-bottom simply helps employees and bolsters the consumption economy.

 🇳🇱
@clacke The problem with these studies is they know going in they intend to show a particular bias and avoid actually study the one part of minimum wage we already know to be true.. that while it doesnt cause **net** job loss it DOES cause the least skilled workers to loose their jobs and have them replaced with higher-skilled workers.
This is why they always look at net jobs to determine job loss and not job loss by education or skill level which would actually show that the minimum wage is harming the poorest (least skilled) of the population.
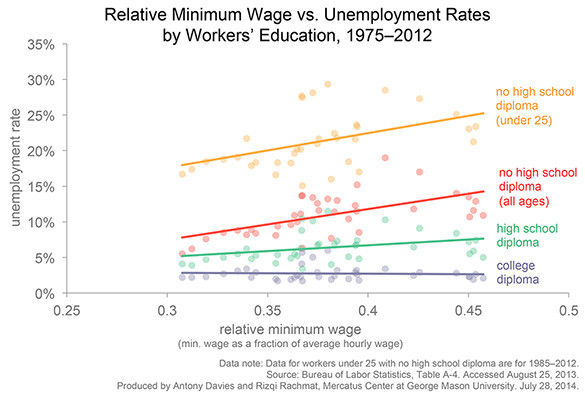

@clacke Possibly, but thats not what im saying. The study doesnt breakdown by education/skill if it did it would show low skill people started loosing their jobs and high skilled got more jobs, but they didnt do that breakdown.
The reason you dont see the "net number of jobs stay the same" in the chart i provided is because the X axis is not time, it is not showing you a chart of.a town or city and how its employment rates changed as minimum wage changed... it is instead comparing many different locations and at different points of time (Each dot) and looking at how minimum wage correlated to unemployment for each class of people.
In effect the net number of jobs and how they changed by minimum wage changes is not shown and can not be deduced from the chart I gave since it is not showing a before-after (or any time based) comparison
@clacke In other words that chart I showed tells you nothing about how long its been since the minimum wage was enacted or how the overall employment rate compared bofore or after a change.
All it is showing you is that when minimum wage is higher then a much larger portion of the unumployment burden is on the least skilled members of the population
But then the diagram actually refers to minimum wage as a ratio of an average wage, so if wages overall go up when the minimum wage does (which they do by definition to some extent, but they may also increase further as a side-effect), that wouldn't necessarily be visible.
> But then the diagram actually refers to minimum wage as a ratio of an average wage, so if wages overall go up when the minimum wage does (which they do by definition to some extent, but they may also increase further as a side-effect), that wouldn't necessarily be visible.
its not that so much as the fact that your missing a bit of causative action in in the correlation diagram that correlation cant show... let me explain better...
Generally speaking the populations that demand increases in minimum wage the most are populations with larger poor populations. They arent educated enough to know its harmful to them and are in large enough numbers to sway political decisions. So these populations tend to be the ones that have the most upward pressure on minimum wage.
Likewise because an increase in minimum wage is most harmful to the least skilled and most poor part of the population the higher it is the less able poor people are to get out of their situation, so likewise minimum wage tends to cause an increasing poor population over time.
Because of these two factors the causitive direction can be reversed from what youd expect, that is populations with large portions of the poor are just as likely to cause a high minimum wage as a high minimum wage is likely to cause a larger population of poor
therefore the net unemployment of points on that chart ARE higher than points with lower minimum wage (as you pointed out), but that is not a contradiction to the study and ones like it that suggest net unemployment stays constant. It simply means that the places that enacted higher minimum wages likely had higher unemployment rates (net) prior to the rate increase as well as after, they just happen to be the ones more likely to raise unemployment.
