

🎓 Dr. Freemo  🇳🇱
@freemo@social.cleverlibre.org
- UFoI Member
- http://UFoI.org/u/freemo/
- Website
- http://JeffreyFreeman.me
- Gitlab
- https://git.qoto.org/freemo
Admin
Jeffrey Phillips Freeman
Innovator & Entrepreneur in Machine Learning, Evolutionary Computing & Big Data. Avid SCUBA diver, Open-source developer, HAM radio operator, astrophotographer, and anything nerdy.
Born and raised in Philadelphia, PA, USA, currently living in Utrecht, Netherlands, USA, and Thailand. Was also living in Israel, but left.
Pronouns: Sir / Mister
(Above pronouns are not intended to mock, i will respect any persons pronouns and only wish pronouns to show respect be used with me as well. These are called neopronouns, see an example of the word "frog" used as a neopronoun here: http://tinyurl.com/44hhej89 )
A proud member of the Penobscot Native American tribe, as well as a Mayflower passenger descendant. I sometimes post about my genealogical history.
My stance on various issues:
Education: Free to PhD, tax paid
Abortion: Protected, tax paid, limited time-frame
Welfare: Yes, no one should starve
UBI: No, use welfare
Racism: is real
Guns: Shall not be infringed
LGBT+/minorities: Support
Pronouns: Will respect
Trump: Moron, evil
Biden: Senile, racist
Police: ACAB
Drugs: Fully legal, no prescriptions needed
GPG/PGP Fingerprint: 8B23 64CD 2403 6DCB 7531 01D0 052D DA8E 0506 CBCE
Joined Jul 2018
Wow dude, he isnt a doctor. I just looked for the source of this post, its from a comment thread on a webpage you screen shotted. Absolutely nothing to indicate he is a doctor... nice try, lololol.
Also to be clear here, I didnt use correlation in my argument, I used granger causality. This was very intentional on my part
Please show full sources and your work.. specifically where your getting data from and the worksheet you used to do the calculations so it can be reviewed.
My party of racial eugenics? What the fuck are you talking about, since when did the Libertarian party do racial eugenics?
If your so riddled with propaganda and bias you assume, and get wrong, my personal party how in the world can I expect you to be objective enough to deal with the subject matter at hand at all?
For that matter if the data is so untrustworthy then why did **you** use that same data in your original post as if it was meaningful when you thought it agreed with you? Now all of a sudden the same data you used actually shows your wrong its bad data.
See the problem there? Again we call that cherry picking.
Your point? Hawaii's death count in the period of the OP increased about 4 or 5 fold, New yorks increased 6 fold, Texas increased 40 fold. The OP's point is a failure whether you compare against hawaii or new york, if you bother to normalize for population of course and not use invalid statistics.
I am not trusting the statistics from any one "people" im trusting the statistics from many independent sources that all agree rather closely with each other. I would never rely on a single source by itself unless I verified indepdendent sources confirmed the data, and they have.
How is that relevant. The numbers I used were normalized per population (relative change), you are not normalizing per population and using absolute numbers, ergo not valid. You cant just argue against good statistics with bad ones and think that makes a point of some kind.
@Salaru How exactly am I "ignoring" that, none of that was discussed until just now.
::motions generally at everything::
Though this is the last thing i saw before commenting that: https://baraag.net/@gaypaw/106943395787908931
The internet needs some fucking therapy...
@Salaru I'm well aware of the anti-vax propaganda when it comes to making up vaccine deaths. I've been through this discussion countless times.
We call this cherry-picked data. Do the same chart but now look at COVID **deaths**. Texas has had a 40x increase in deaths over that time. Hawaii has had only about a 4x increase in the same time period.
Its almost like the vaccines are keeping people from dying or getting the disease as strongly... funny that, its doing what its supposed to.
About half the fediverse need sto hear this, but won't listen.
🎓 Dr. Freemo 🇳🇱
boosted
🇳🇱
boosted

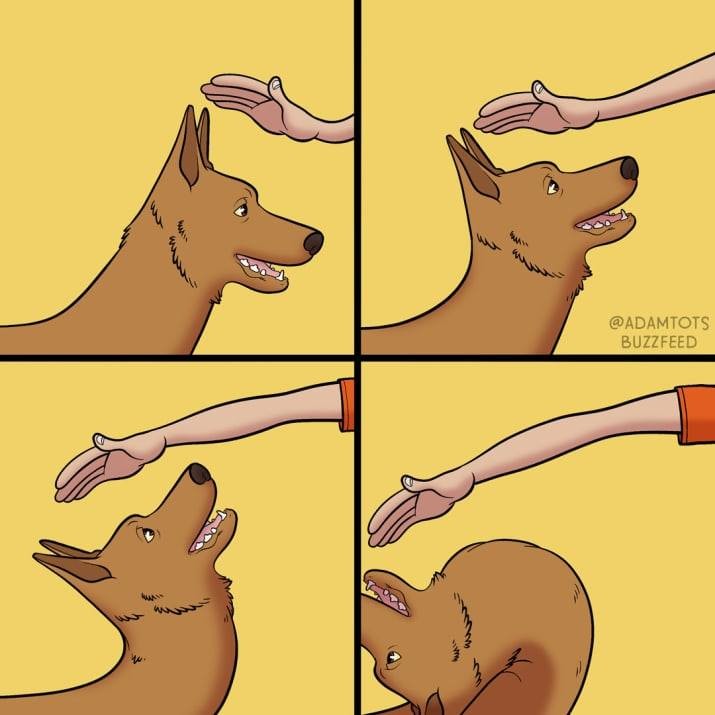

How much net work could a network work, if a network could net work?
This poll kinda played out exactly how I predicted.. interesting.
🇳🇱
@freemo@social.cleverlibre.org
Is your biggest role model of the opposite sex?
- UFoI Member
- http://UFoI.org/u/freemo/
- Website
- http://JeffreyFreeman.me
- Gitlab
- https://git.qoto.org/freemo
Admin
Jeffrey Phillips Freeman
Innovator & Entrepreneur in Machine Learning, Evolutionary Computing & Big Data. Avid SCUBA diver, Open-source developer, HAM radio operator, astrophotographer, and anything nerdy.
Born and raised in Philadelphia, PA, USA, currently living in Utrecht, Netherlands, USA, and Thailand. Was also living in Israel, but left.
Pronouns: Sir / Mister
(Above pronouns are not intended to mock, i will respect any persons pronouns and only wish pronouns to show respect be used with me as well. These are called neopronouns, see an example of the word "frog" used as a neopronoun here: http://tinyurl.com/44hhej89 )
A proud member of the Penobscot Native American tribe, as well as a Mayflower passenger descendant. I sometimes post about my genealogical history.
My stance on various issues:
Education: Free to PhD, tax paid
Abortion: Protected, tax paid, limited time-frame
Welfare: Yes, no one should starve
UBI: No, use welfare
Racism: is real
Guns: Shall not be infringed
LGBT+/minorities: Support
Pronouns: Will respect
Trump: Moron, evil
Biden: Senile, racist
Police: ACAB
Drugs: Fully legal, no prescriptions needed
GPG/PGP Fingerprint: 8B23 64CD 2403 6DCB 7531 01D0 052D DA8E 0506 CBCE
Joined Jul 2018
