

Martin Ruskov @mapto@social.cleverlibre.org
- Research
- https://www.zotero.org/mapto
- Games
- https://mapto.itch.io
- Account in Bulgarian
- https://masto.bg/@mapto
Studying how people interact, in the past (#CulturalAnalytics) and today (#EdTech #Crowdsourcing). Researcher at @IslabUnimi, University of Milan. Bulgarian activist for legal reform with @pravosadiezv. I use dedicated accounts for different languages.
My profile is searchable with https://www.tootfinder.ch/
Joined Nov 2022
Martin Ruskov
boosted

Sometimes, the best way to protect a replanted forest is to log some of it.
New research from Smithsonian Institution scientists shows that paying people who replant tropical forests with some of the timber has benefits for both #ClimateJustice and the ecosystem, as it can lead to longer-term sustainability as participants feel a sense of pride and responsibility for the project’s success.
https://theconversation.com/paying-people-to-replant-tropical-forests-and-letting-them-harvest-the-timber-can-pay-off-for-climate-justice-and-environment-219894
#trees
Martin Ruskov
boosted

This strategy of silencing criticism has extended into the digital realm, with X CEO #ElonMusk’s platform playing a pivotal role in the Indian gov’s transnational repression. At the Indian government’s behest, Musk’s platform deleted hundreds of posts sharing a #BBC documentary exposing Modi’s role in a 2002 anti-Muslim massacre that unofficial estimates indicate as many as 2,000 lives.
https://truthout.org/articles/free-speech-absolutist-musk-is-abetting-modis-suppression-of-voices-in-india/
Martin Ruskov
boosted

Camera, Action!
https://crimethinc.com/CameraAction
On January 26 and 27, during the first International Gathering of Anarchist and Anti-Authoritarian Practices against Borders in Tijuana, Mexico, the Ex-Worker Podcast will present a curated series of anarchist films from around the world. In addition to showing our own published shorts and debuting some new material, we will curate a series of anarchist features, dramas, video propaganda, oddities, and experiments.
You're invited to submit your work!
Here, we present our submission parameters and review some of the precedents for anti-border gatherings like this one.
Martin Ruskov
boosted

"right-wing political violence accounted for more than 90% of all attacks or plots in the first half of 2020, far outpacing terrorism from any other source since 1990.
And since 2020, it’s gotten increasingly worse. A Reuters investigation published in August found that U.S. political violence is worse than it’s been at any point since the 1970"
https://inthesetimes.com/article/far-right-mainstream-media-right-wing-tea-party-oath-keepers
Martin Ruskov
boosted

@glennf You may appreciate this history I made, which combined YahooPipes with Delicious for doing monitoring work:
https://bureaucracksy.constantvzw.org/delicious-user-guide/
Martin Ruskov
boosted

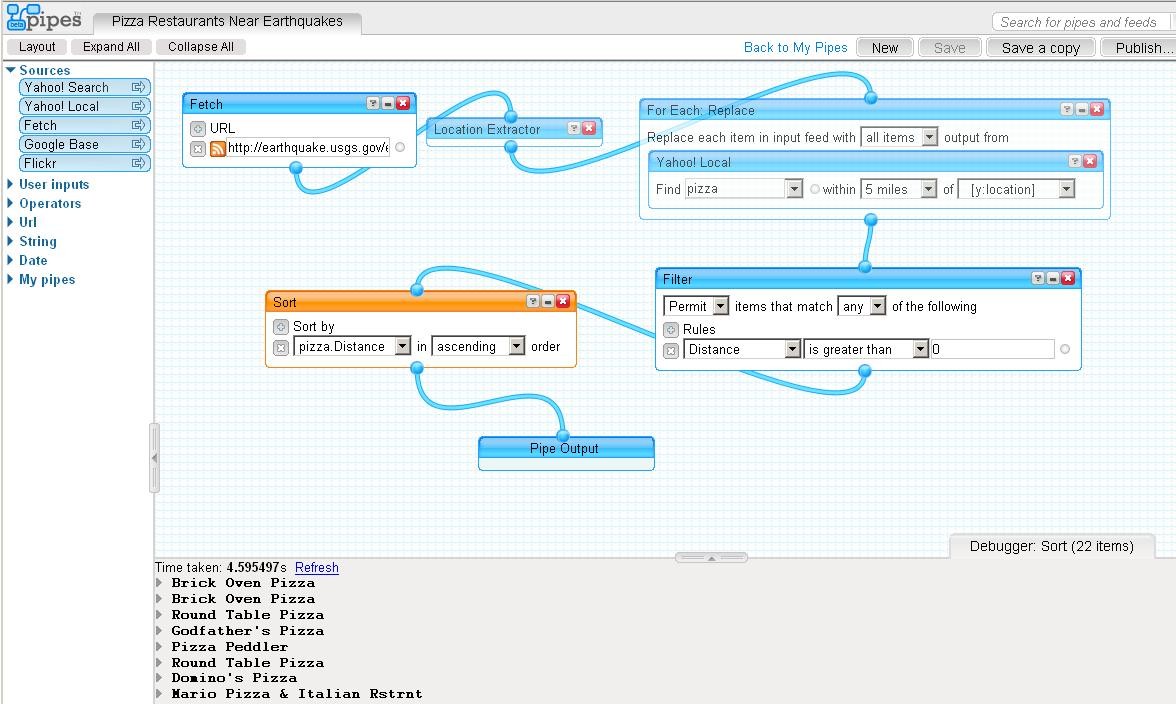
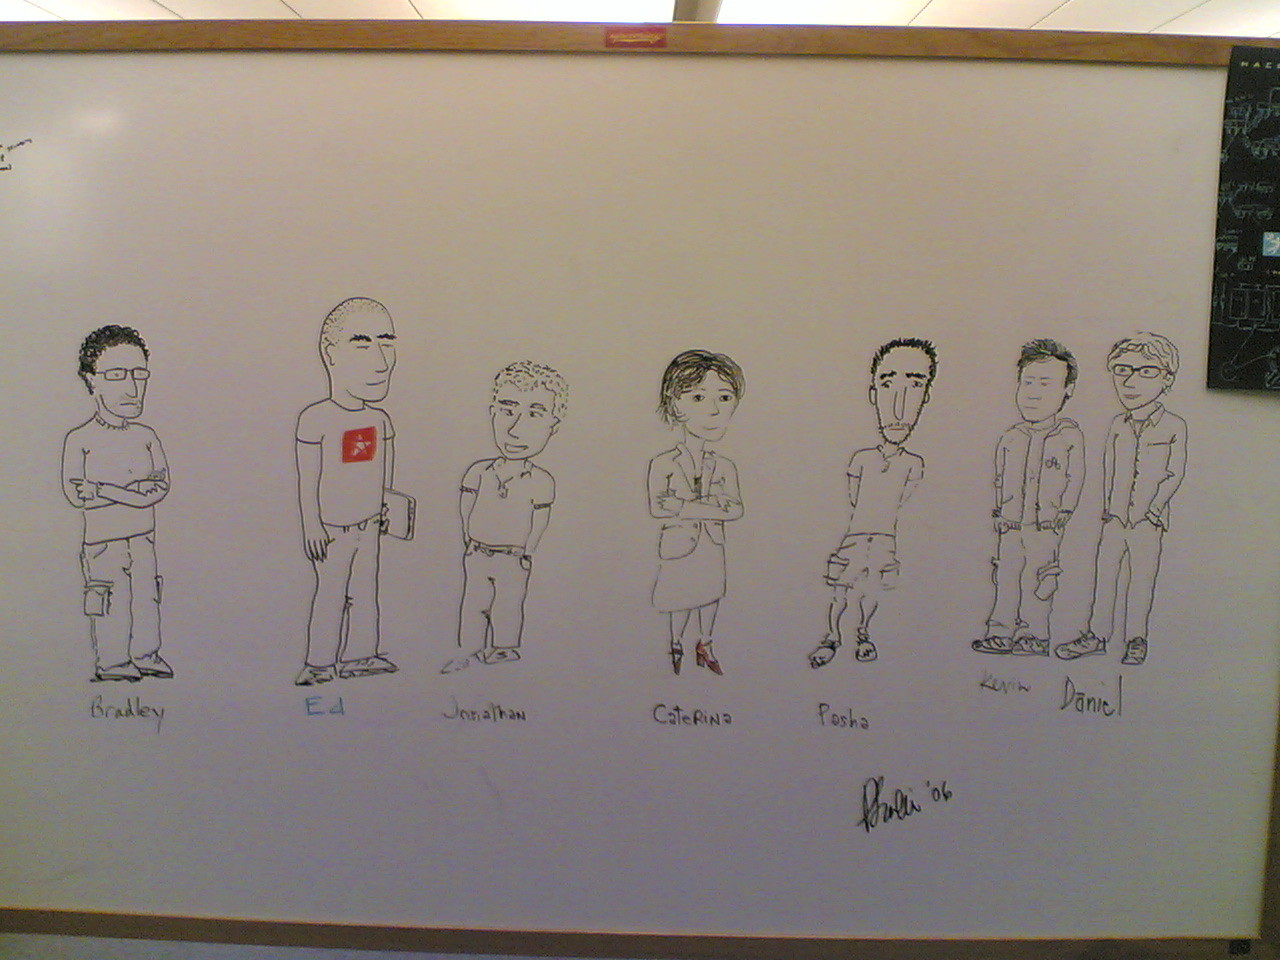
Did you love Yahoo! Pipes and miss it? I sure did. I wrote this history of the graphical web-based processing tool that sure seemed like the future when it was introduced! https://retool.com/pipes I interviewed the core team and several other folks so we could finally have a definitive history. (And forget my words, even—the illustrations are amazing!)
This is part of a series at Retool, a visual programming tools company, that decided to make sure the past wasn’t forgotten.
Martin Ruskov
boosted

We are on the cusp of creating a world where it will be normalized for Mastodon users to follow Threads users and where it will feel strange that a Threads user can’t follow a Twitter user. This is the a vision that many of us have been pushing Meta on for at least 15 years (remember OpenSocial?)
It’s ironic then that the biggest opponents of this future are Mastodon admins who have blocked Threads integration with their slice of the Fediverse.
Who would have expected this outcome?
Now listening to @andreskarjus on #cudan2023 via https://www.youtube.com/watch?v=TZAKyrobWGk
He's presenting his broad range of SotA studies on ChatGPT with preprint available at https://arxiv.org/abs/2309.14379
Martin Ruskov
boosted

I’m in the process of moving all of a parent’s credit, banking, online ordering, and medical accounts over to my phone number bc they (my parent) can no longer deal with five-step logins and mandatory SMS codes across wildly inconsistent patterns and hoooooo boy are the tech companies and systems unprepared for what is about to hit them, generationally.
It took five phone calls, three codes, and two emails to change just one account over.
To me it feels so upsetting to see so many people looking for ways to block Threads now from the start

If you’ve got questions about what interoperability with #Threads means, we wrote this up back in July, and you can still refer to it: https://blog...
Martin Ruskov
boosted

It's very reductive to think of the decent people still on Twitter as shallow idiots.
As was said earlier a oot of networks and communities are vanishing from the platform. Guess what's happening to the remaining members who don't know how to find safe alternatives elsewhere? Or whose friends a support networks are only easily accessible via Xitter?
Many of them are victims of that takeover, I think they deserve a bit more kindness...
Martin Ruskov
boosted

This is unprecedented as far as I know. It is, in fact, historic. Biden staffers organized a vigil outside the #WhiteHouse calling on their boss to call for a ceasefire.
Wow!
And to the staffers, thank you so much!
Търсят се доброволци за превод на свободен софтуер #бгмастодон #бгфеди

100% от интерфейса и двете основни уеб страници на @thunderbird са преведени на български. Ако искате да се включите в подобряването на превода, пи...
Martin Ruskov
boosted





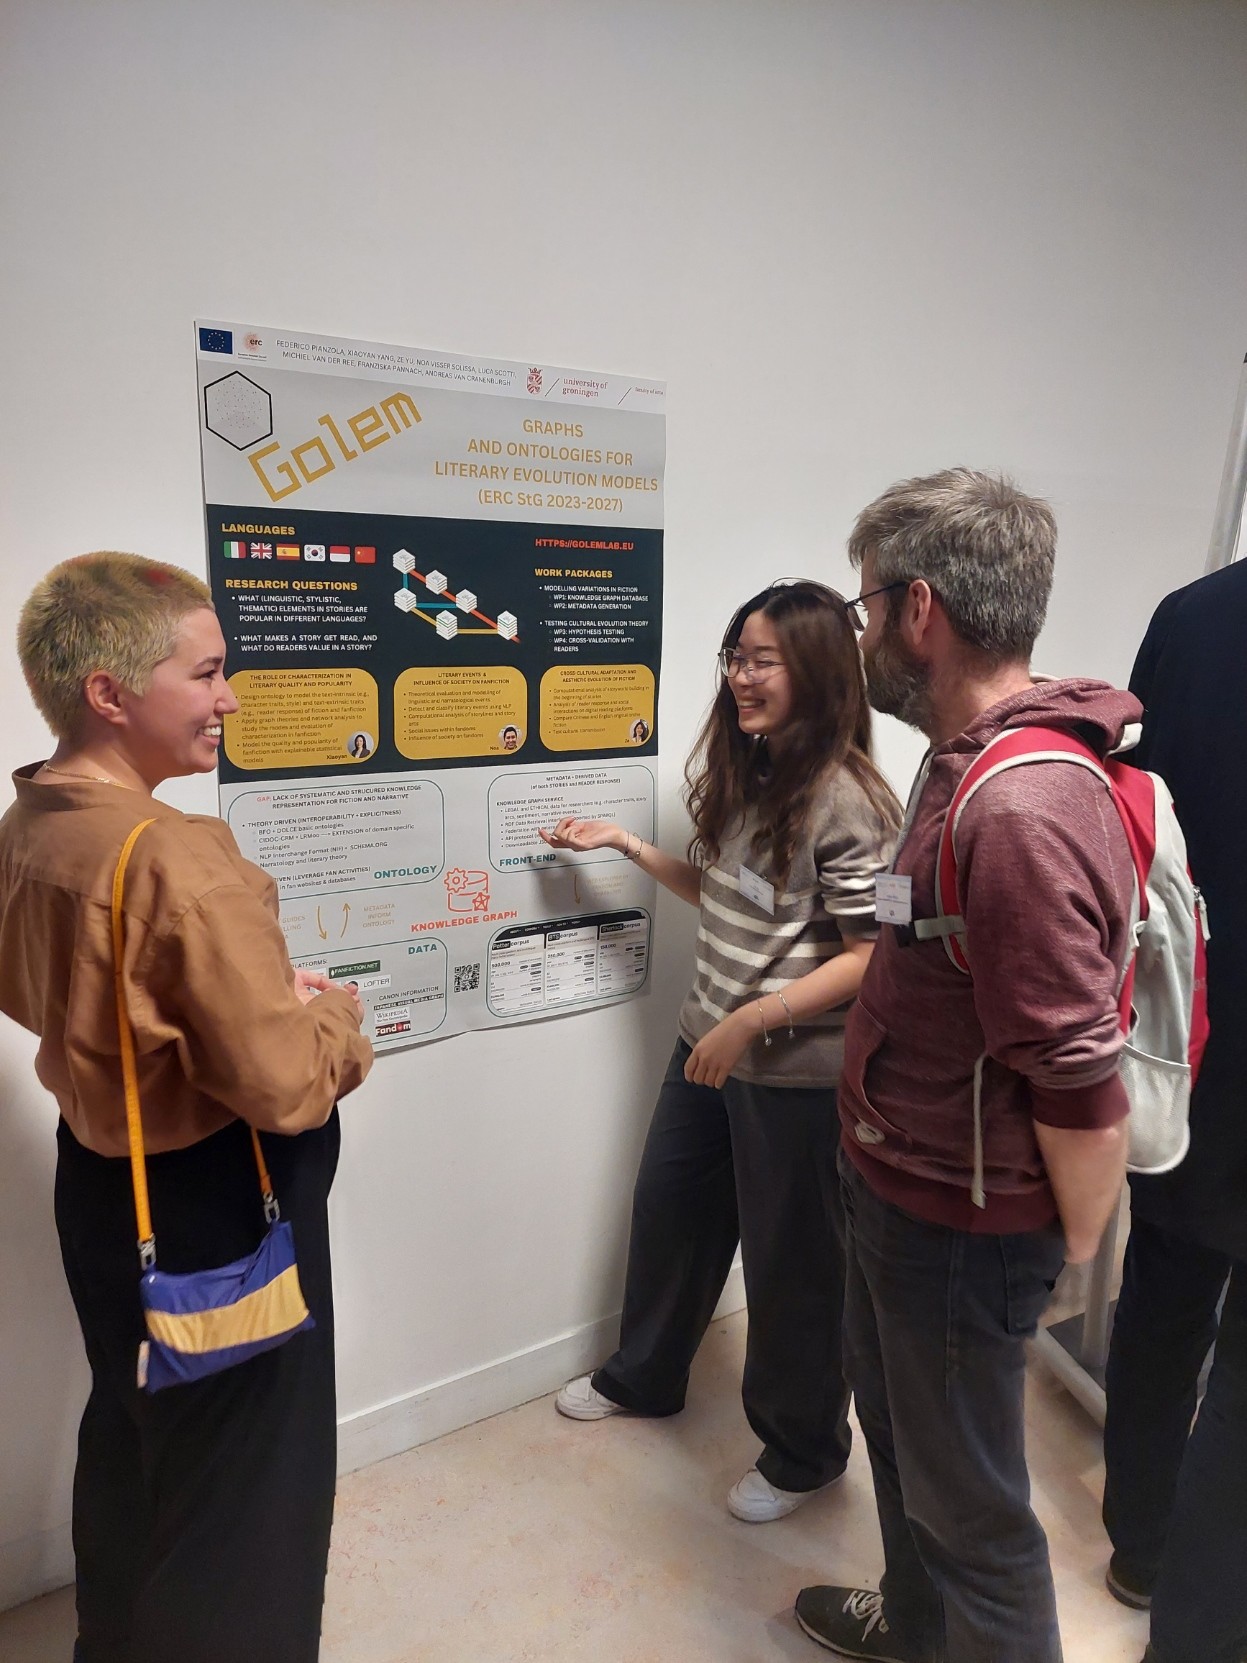
#CHR2023 has been a very rich experience! Already looking forward to CHR2024 in Aarhus where we'll have some first results from the GOLEM project golemlab.eu
Btw, we're also hiring a PhD to work on the computational analysis of narrative in argumentative text
https://www.rug.nl/about-ug/work-with-us/job-opportunities/?details=00347-02S000AI7P
Sorry, that was incorrect. Pratolini is not the only one with two publishers in the UK, but the only one who has two publishers repeatedly translating works of his
Finally, here's the full text. It has more context and examples. We'd love a discussion beyond the one after the presentation https://ceur-ws.org/Vol-3558/paper774.pdf
A note on visualisation. For no good reason a majority of visualisation tools cannot handle categorical dimensions. Probably they can't be bothered with explicitly having to specify an order of the visualisation dimension. This is only one of the reasons we found tools like Excel fast, but too limited to be useful. Programmable tools like ggplot or bokeh are more powerful, but iterations take too long to visualise and that slows down the exploration process. We've found #RAWgraphs a great solution for two reasons. First, it allows categorical dimensions in the charts we used, and second, it allows SVG export for post-processing. So shout out to https://www.rawgraphs.io/
Finally, after a first exploration, one might feel ready to see the big picture, i.e. fusion. Of course after that one might tbacktrack to drill back into particular values.
One way to show multidimensional (nominal data, except for years) that we've found useful is the following graph. But more generally we need visualisation techniques that allow for multidimensional nominal data. For two dimensions heatmaps could be a good candidate. It gets more complicated with more dimensions. Alluvial diagrams could turn handy here

The second pattern is generalisation. It says we should fix our dimension of interest and and vary anything independent of it. We do this by focusing on individual authors and looking of other dimensions (e.g. the interplay between Italian and UK publishers). In the example here, we consider Vasco Pratolini who is the only author from the above graph that has more than one publisher in both countries. Of course this graph is just a start of an enquiry as to why this occurs. In our case we actually had to look into the archives of publisher exchange to get an understanding, but that's beyond the topic here.
PS: Sorry for the transparent backgrounds of images that don't work well on dark app themes. The graphs can be seen better in the paper which is at the end of this thread

These patterns of variation consider aspects of phenomenon, which at a simple level could be seen as dimensions of data. The simplest of the three patterns is contrast, the idea that to start understanding a phenomenon one needs, to consider each of its dimensions in isolation (i.e. variating it while keeping others fixed). Our example is from translation of Italian novels from the post-war period into the UK market. We apply contrast on authors. Our way to fix other dimensions is by counting them

- Research
- https://www.zotero.org/mapto
- Games
- https://mapto.itch.io
- Account in Bulgarian
- https://masto.bg/@mapto
Studying how people interact, in the past (#CulturalAnalytics) and today (#EdTech #Crowdsourcing). Researcher at @IslabUnimi, University of Milan. Bulgarian activist for legal reform with @pravosadiezv. I use dedicated accounts for different languages.
My profile is searchable with https://www.tootfinder.ch/
Joined Nov 2022
