@ingalls Can you explain how to read this chart? What are the axes? (I assume the horizontal one is degrees Celsius, but I'm confused because the vertical one is labeled twice, once increasing downward and once increasing upward.) What are the red and green lines?


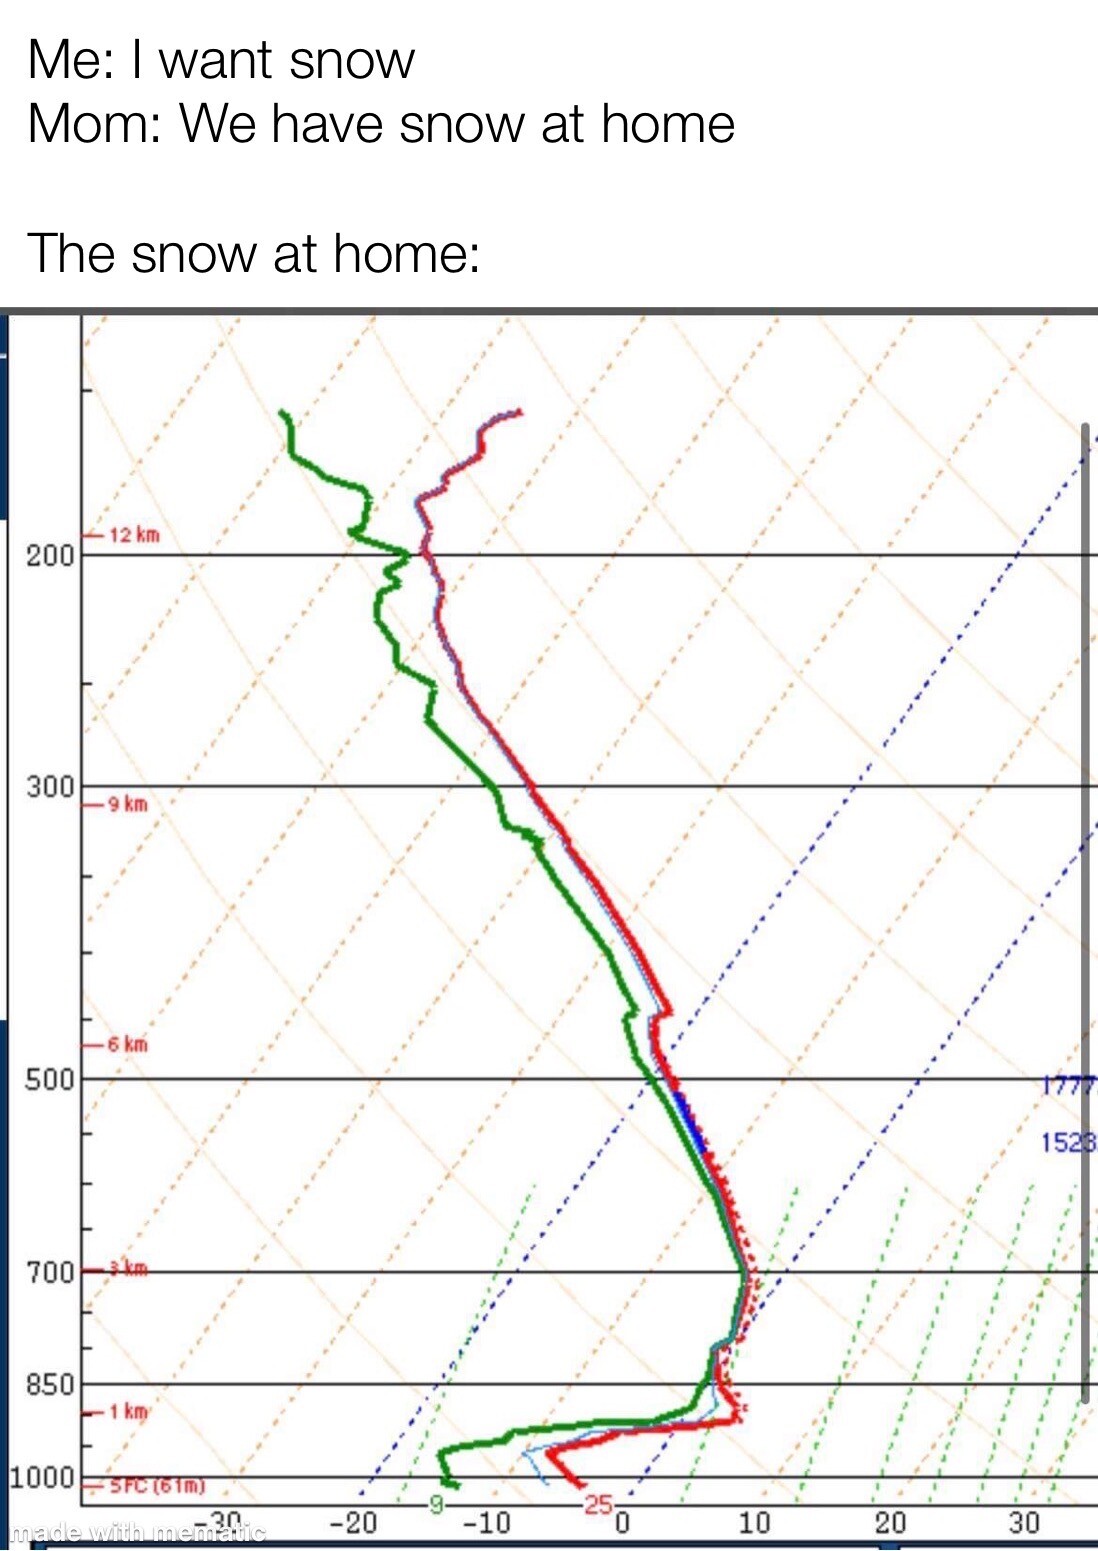
@peterdrake see alt text for a description