


Follow
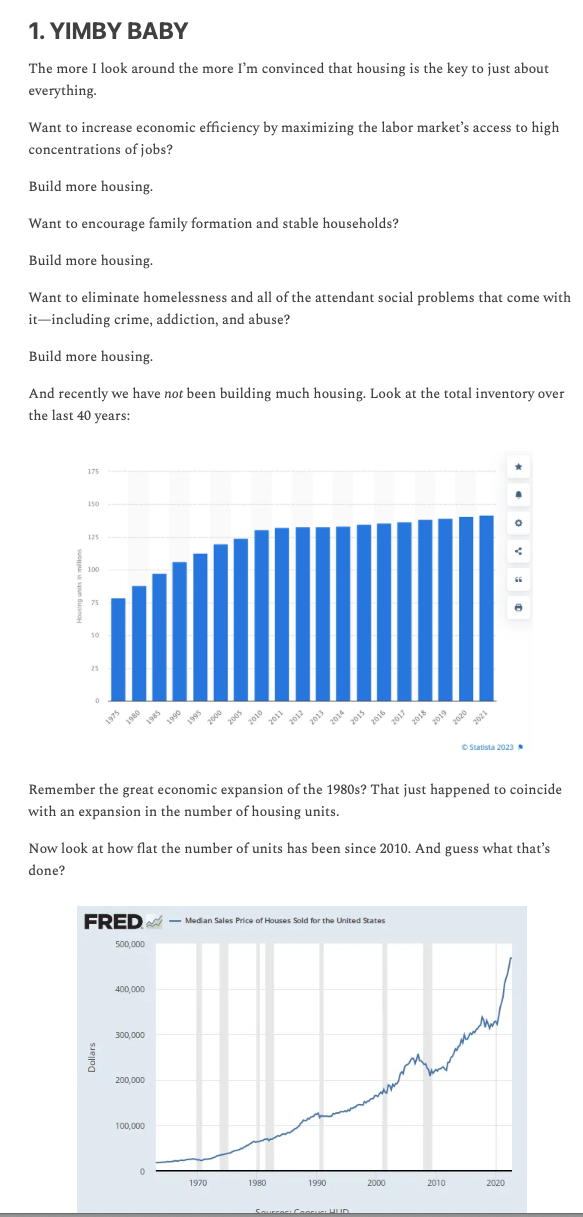
@brendannyhan The cumulative plot of housing units is purposely deceptive. Look at the X axis of the cumulative plot of housing units. 5 year increments from 1975 to 2010 and 1 year after 2010. Embarrassing.

@brendannyhan The cumulative plot of housing units is purposely deceptive. Look at the X axis of the cumulative plot of housing units. 5 year increments from 1975 to 2010 and 1 year after 2010. Embarrassing.